- 02 Aug 2024
- 3 Minutes to read
Working with background maps
- Updated on 02 Aug 2024
- 3 Minutes to read
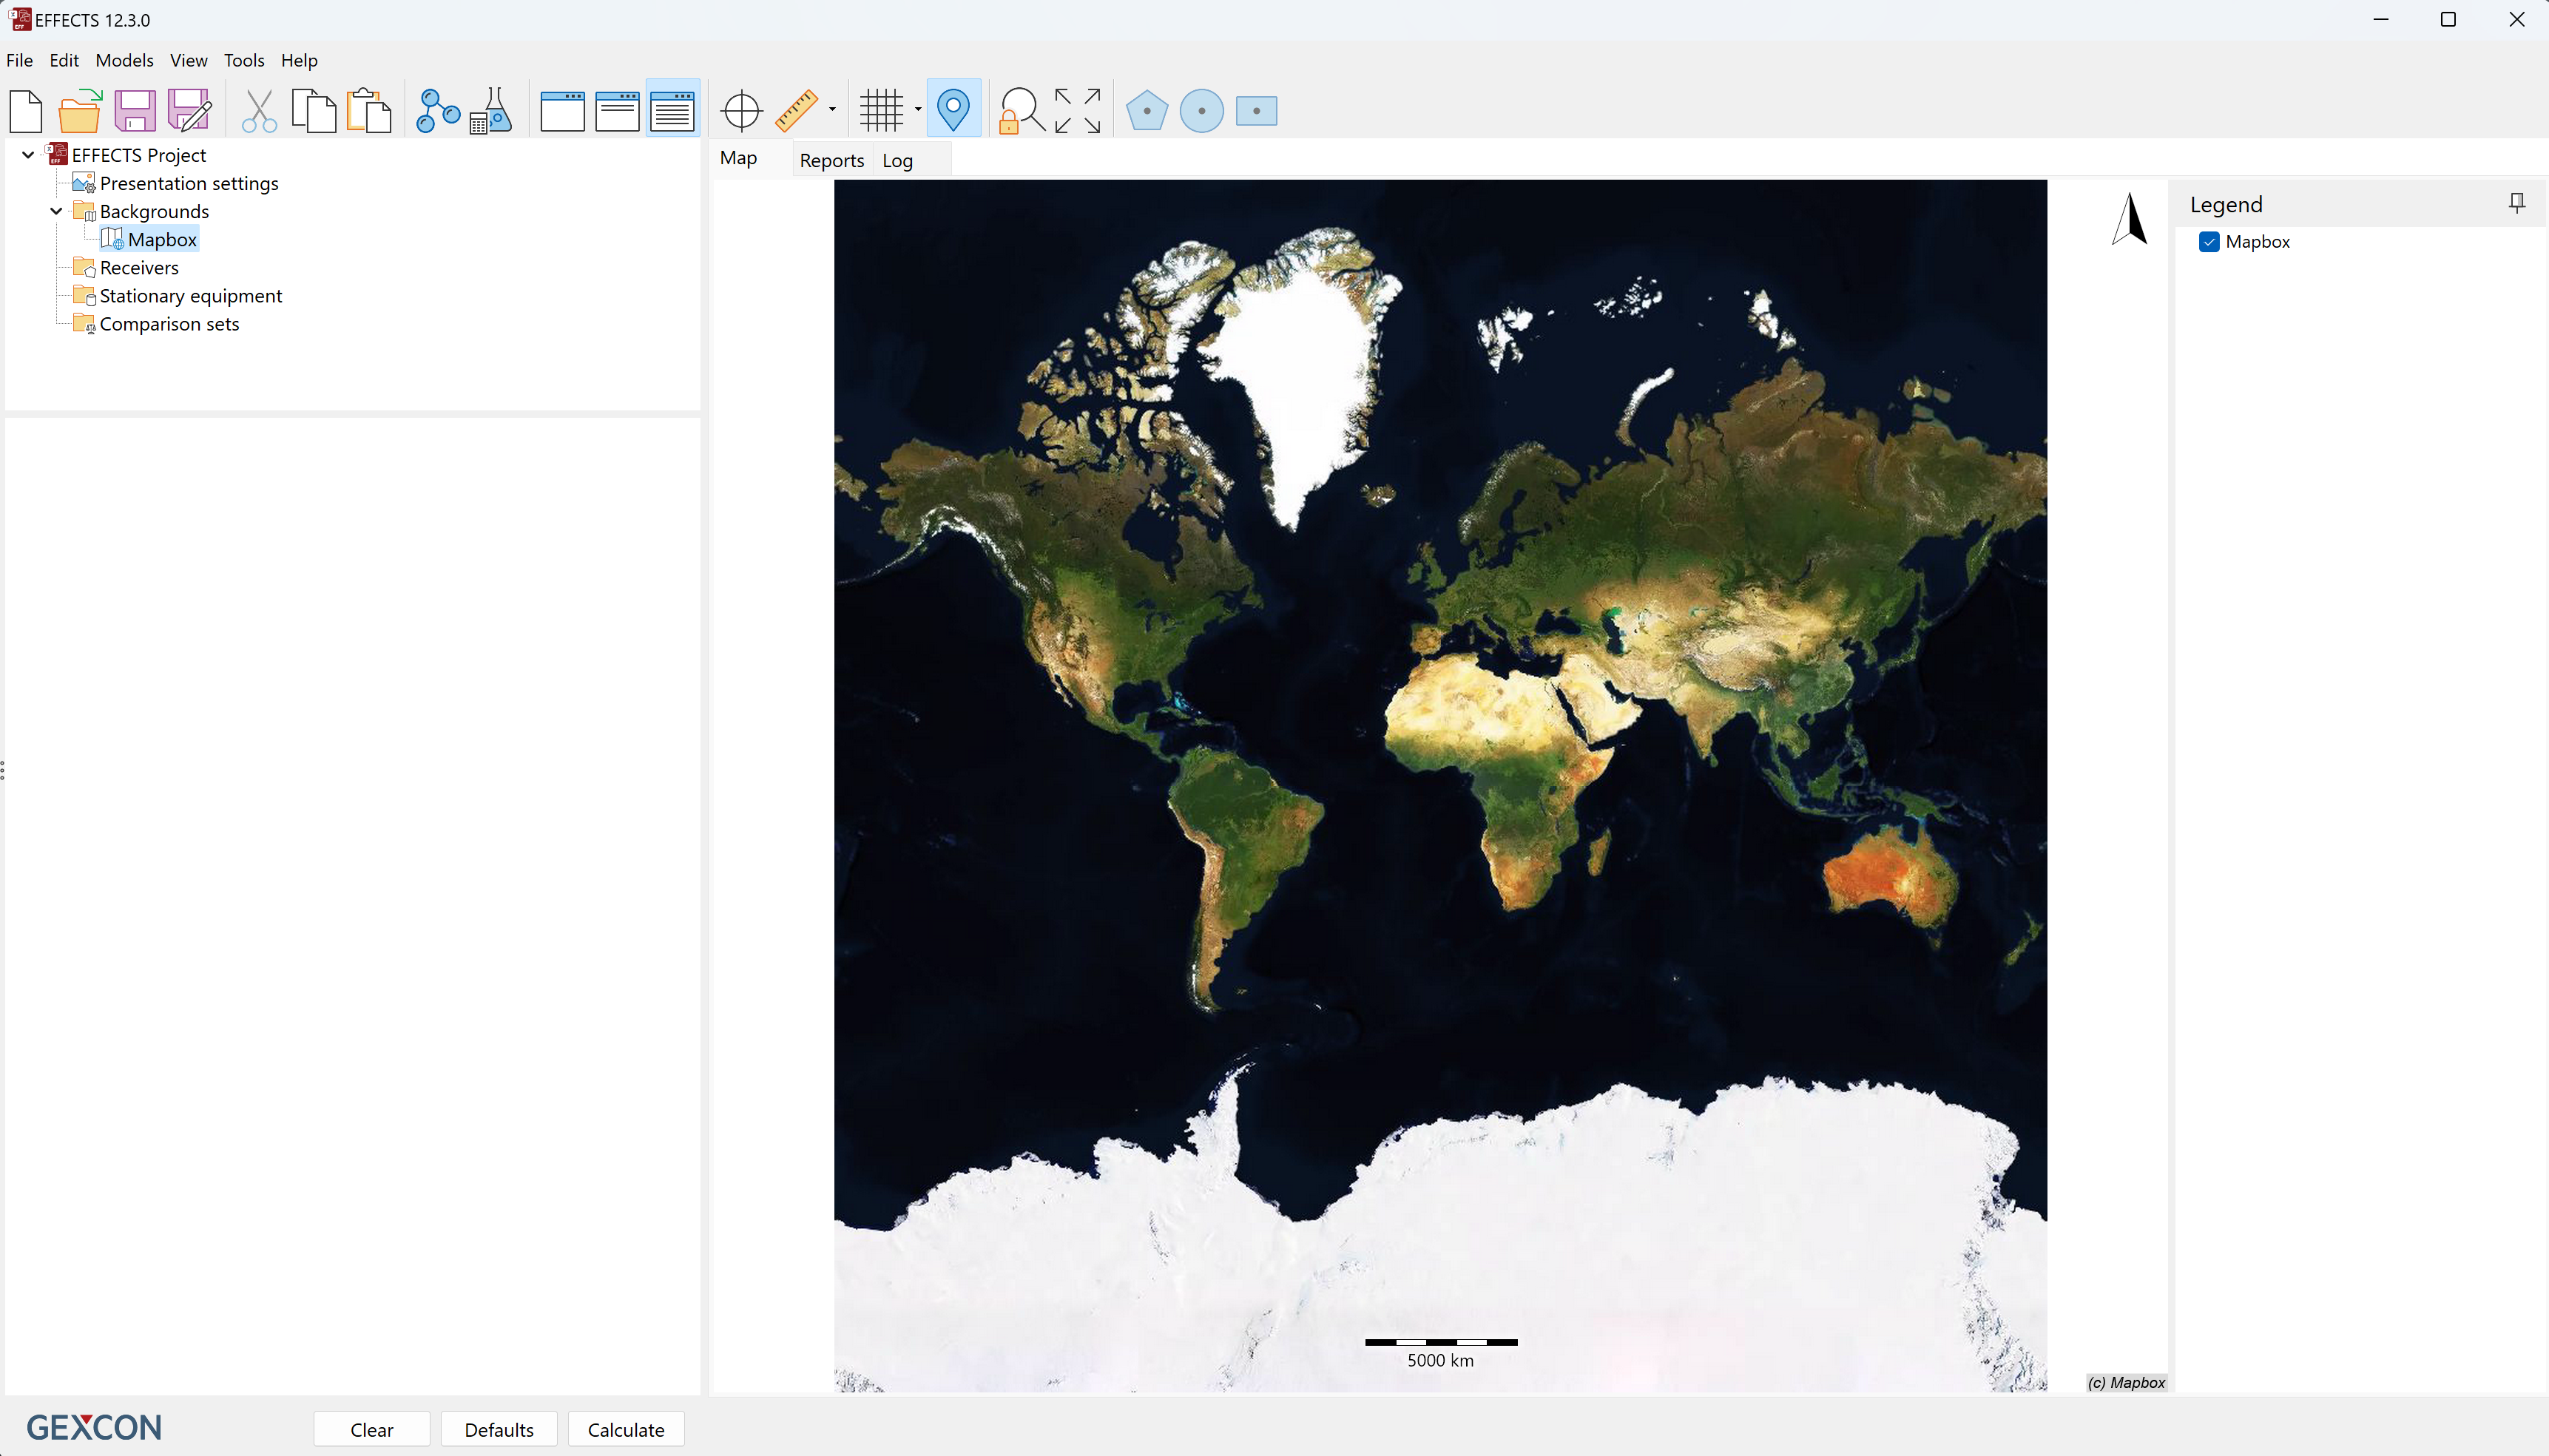
EFFECTS and RISKCURVES offer a versatile platform that supports various backgrounds including background maps from files (such as images or AUTOCAD drawings) or tile severs directly from the internet. Background maps play a crucial role in visually representing consequence modelling results on top of a map. This functionality gives users comprehensive control to accurately locate where the accidental release of a hazardous chemical substance occurs, and assess its impact on surrounding vulnerable areas.
Types of background maps
There are two main types of background maps that can be added to EFFECTS and RISKCURVES: from internet connected servers or local files.
Tile servers
Tile servers provide up-to-date, detailed geographical information by fetching a set of images (tiles) from an internet connected server. The main advantage of tile servers is that the map is immediately scaled and correctly georeferenced. Please refer to the article “How to add a tile server” for more information on how to use this functionality in EFFECTS and RISKCURVES.
However, they require a stable internet connection. To use a georeferenced map without an internet connection, you can export it from a tile server. For more information, refer to the article “How to export a georeferenced map from a tile server”.

File-based maps
The other way of defining your background map in EFFECTS is to use file-based maps.
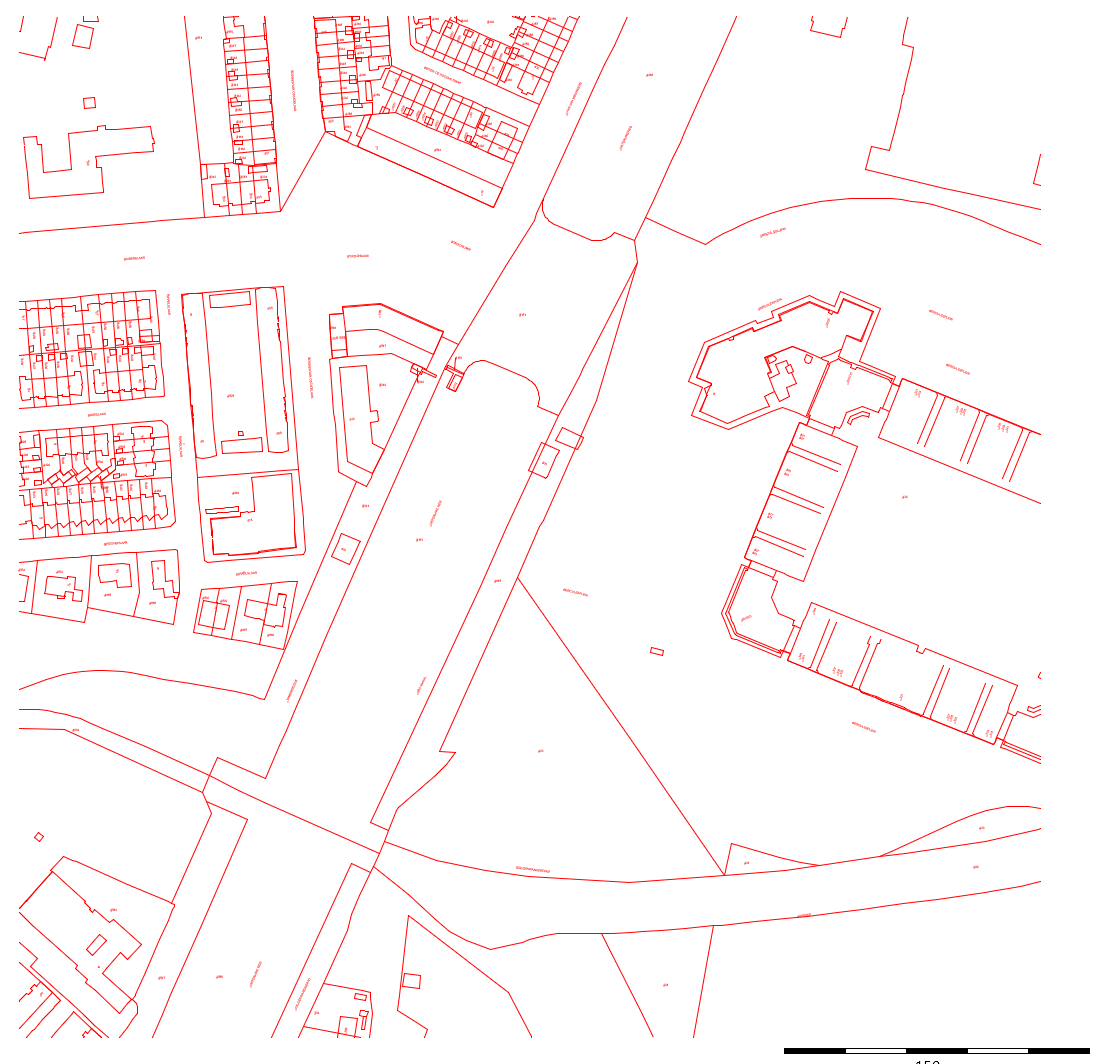
Shape files and DXF files (e.g., AUTOCAD drawing): These may require specifying the projection system, as they are vector-based images. Vector-based map images use mathematical equations and geometric shapes to represent geographic features, ensuring they can be scaled infinitely without losing quality. This scalability and precision make them ideal for applications requiring detailed and flexible map visuals, such as geographic information systems (GIS).

Image files (JPG, PNG, TIFF, GIF and BMP): These images files are also supported and can be used in a relative system or georeferenced for export into GIS systems. Images based files require georeferencing as they are pixel-based files, which consist of a grid of individual pixels, each representing a specific color, which allows for detailed and complex visual representations of geographic areas. However, they are resolution-dependent and can lose clarity when scaled, making them less flexible than vector-based maps for applications requiring frequent resizing. For more details on georeferencing, refer to the article “How to georeference a background map”.

Benefits of using background maps
Background maps can be utilized in both absolute and relative positions, depending on the requirements of the analysis:
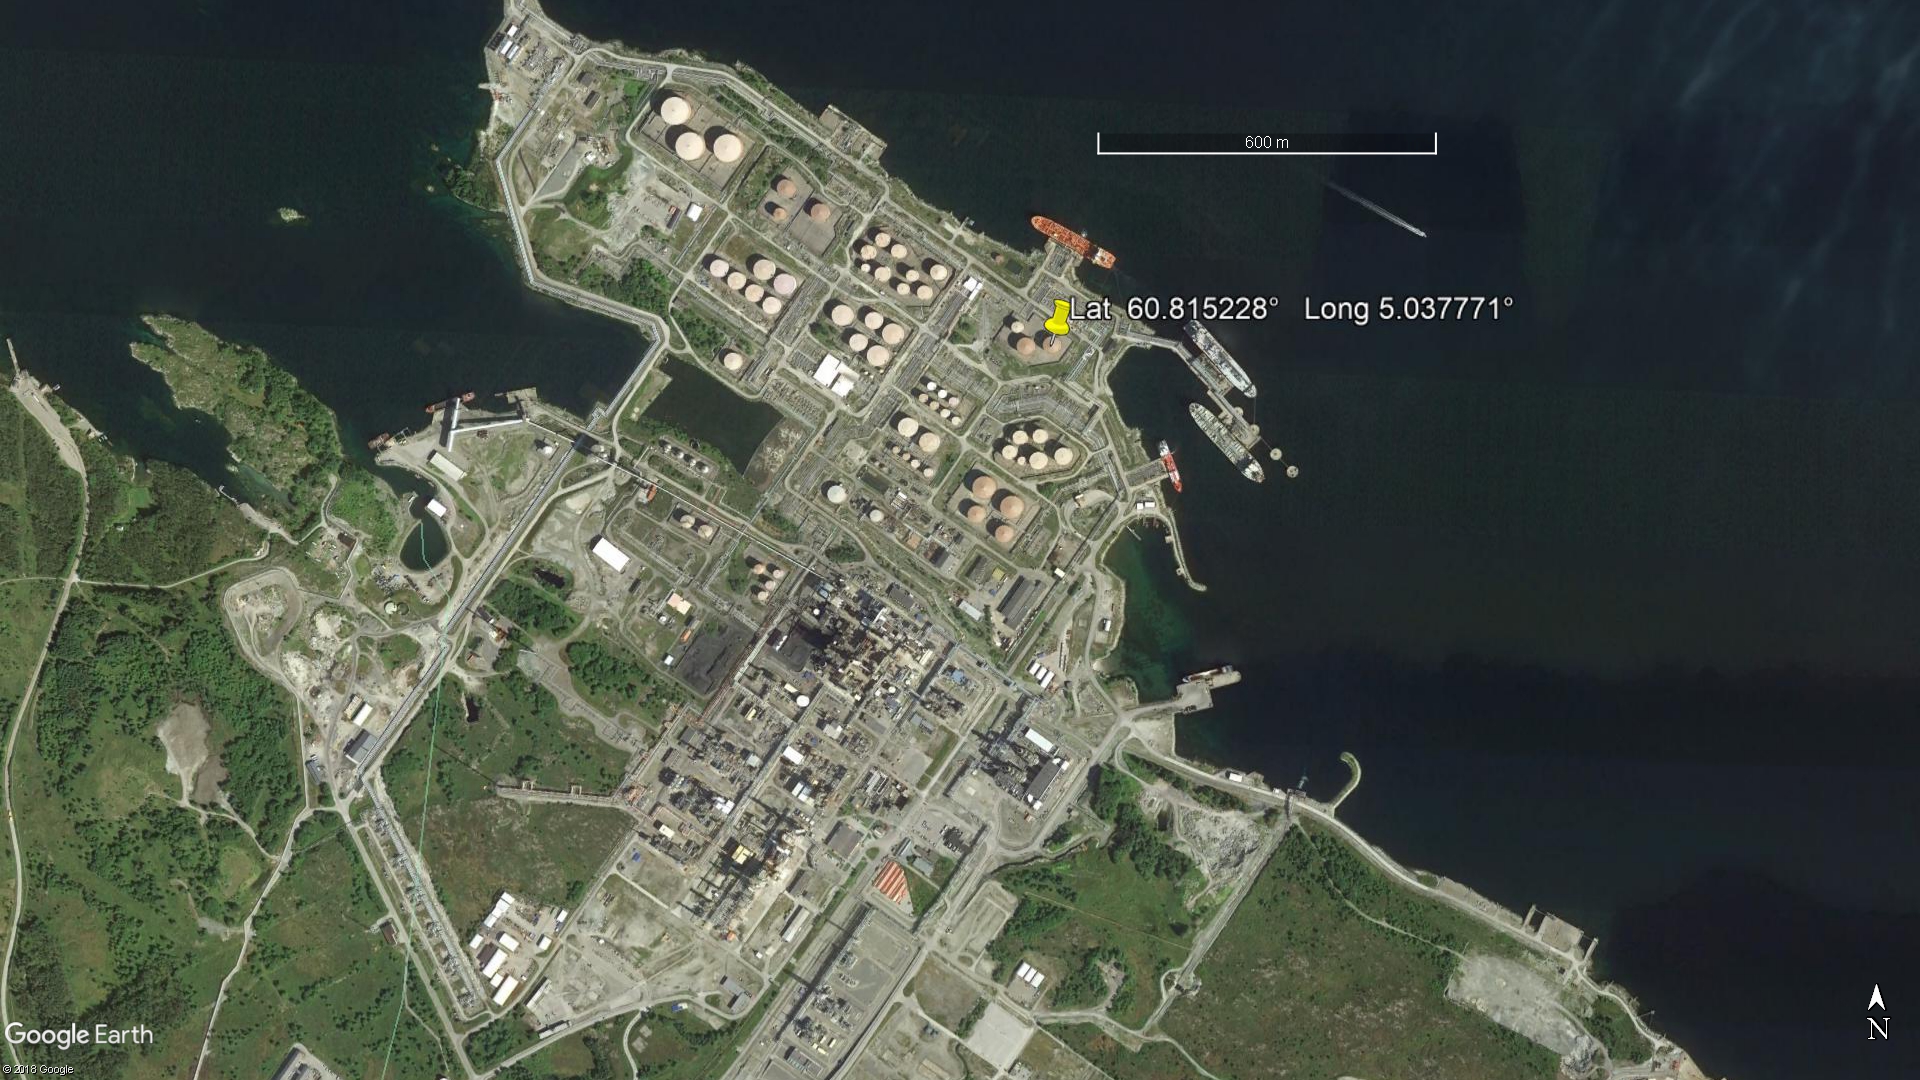
Absolute positioning: Facilitates the integration of results into Geographic Information Systems (GIS), essential for analyses that need to be exported and shared with external systems. For example, read “How to export consequence results into Google Earth” to see how to export results from EFFECTS or RISKCURVES into Google Earth.
Relative positioning: Suitable for internal analyses that do not require file export, with backgrounds positioned around a relative point (e.g., coordinates (0,0)).
The benefits of using background maps include:
Enhanced visualization: Allows users to visualize the geographic context of the consequence modeling results, providing a clearer understanding of the potential impact on surrounding vulnerable areas.
Improved accuracy: Enables precise assessment of risks to vulnerable areas such as residential zones, hospitals, and industrial facilities by accurately pinpointing the location of hazardous release.
Integration with GIS: Supports seamless integration of results into GIS systems for further analysis and reporting.
Conclusion
The ability to add and configure background maps in EFFECTS and RISKCURVES significantly enhances the user's capacity to conduct detailed and accurate consequence modeling. Whether using file-based maps for internal analysis or tile server maps for dynamic, real-time data, this functionality provides critical insights into the potential impacts of hazardous chemical releases. By supporting both absolute and relative positioning, EFFECTS and RISKCURVES offer flexibility and precision in risk assessment and consequence analysis.

