Multiscenario
- 21 May 2025
- 7 Minutes to read
Multiscenario
- Updated on 21 May 2025
- 7 Minutes to read
Article summary
Did you find this summary helpful?
Thank you for your feedback!
Multiscenario provides functionality for creating and generating multiple variations of a base scenario quickly and easily within CASD. This section details the functionality and user interface of the tool. Example cases and videos demonstrations of multiscenario setups can be found here.
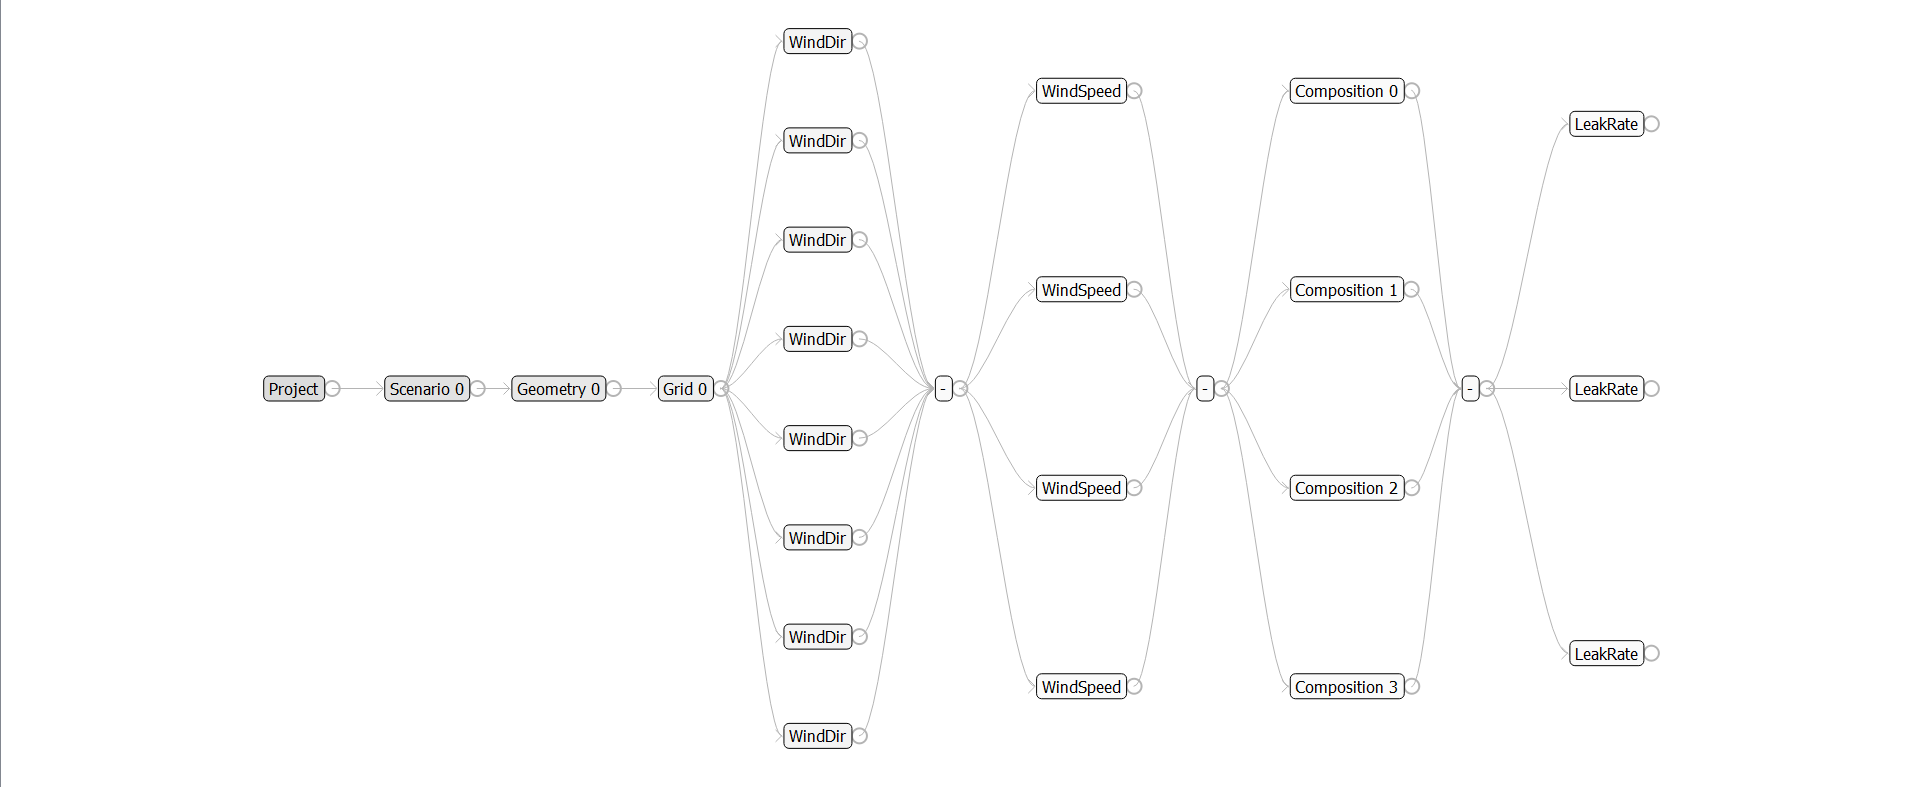
Tree view of scenarios created with multiscenario
Creating a new project
A .thf project file is created by CASD when creating a multiscenario project. To start a multiscenario project navigate to: File → New Project. Following this a pop-out window will appear and require user input. The pop-out is shown and the inputs are explained below:
Name: a user defined string to name the new project
Base scenario: this is the scenario that will be used as the default template for all variation scenarios
Input Directory: the location of the base scenario
Scenario: a drop-down selection of scenarios found within the input directory
Output Directory: the output location for generated scenario files.
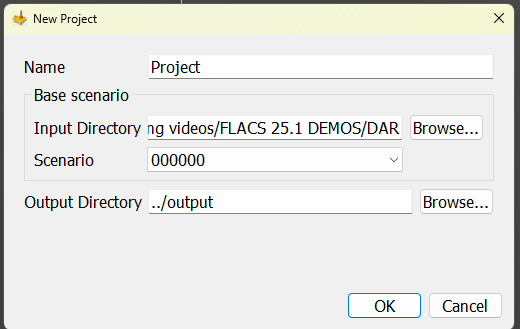
New project information dialogue pop out window
Creating a new project based on a template scenario
If you have a scenario open in CASD prior to starting a new project, the current scenario will be selected as the base scenario by default. Alternatively, navigate to the base scenario via the multiscenario pop-out.
Saving and opening projects
To save the project go to File → Save. Project is saved as thf file.
To open project go to File→Open... and select the desired thf file.
Multiscenario interface
After creating a project, CASD switches to the Multiscenario layout. A number of different views are available in the Multiscenario layout:
Graph View: the main view to visualise and create scenarios and inspect nodes.
Table View: to visualise all scenarios in the Multiscenario setup and relevant information
3D View: visualisation of geometries, grids and scenario elements.
Node Properties: node information, data and properties are displayed and can be edited or added.
By default, the layout is split into four panes however, other views not visible by default can be enabled by right-clicking on the toolbar. The views can be resized, rearranged and closed. Customised layouts can be saved to the Multiscenario window toolbar via Save layout in the toolbar.
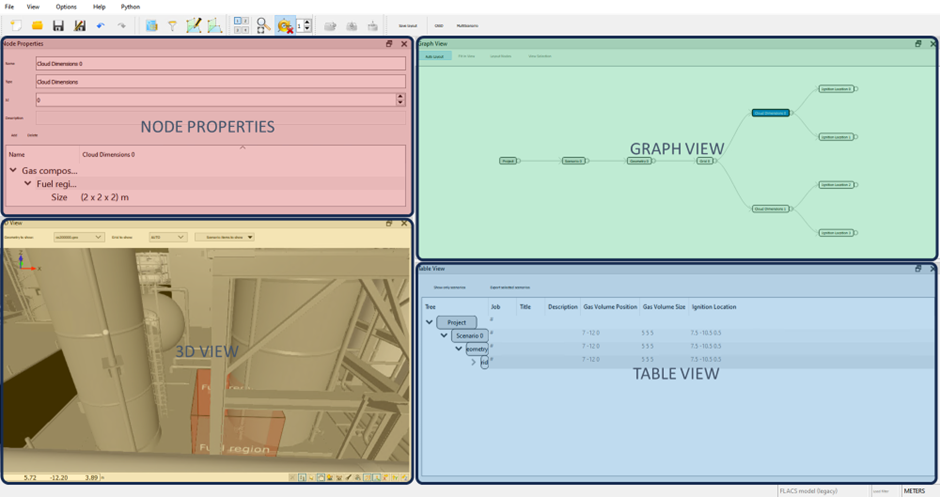
Layout of multiscenario window
Graph view
The graph view is the main view for setting up scenarios and adding nodes which allow for variables to be input.
The graph view is made up of nodes (highlighted in orange below) and connectors (highlighted in the dashed black boxes below).
When creating a new project the following nodes are created by default:
Project/Root
Scenario
Geometry
Grid
Additional nodes can be added to create scenarios with different input parameters such as wind, cloud dimensions and cloud locations.
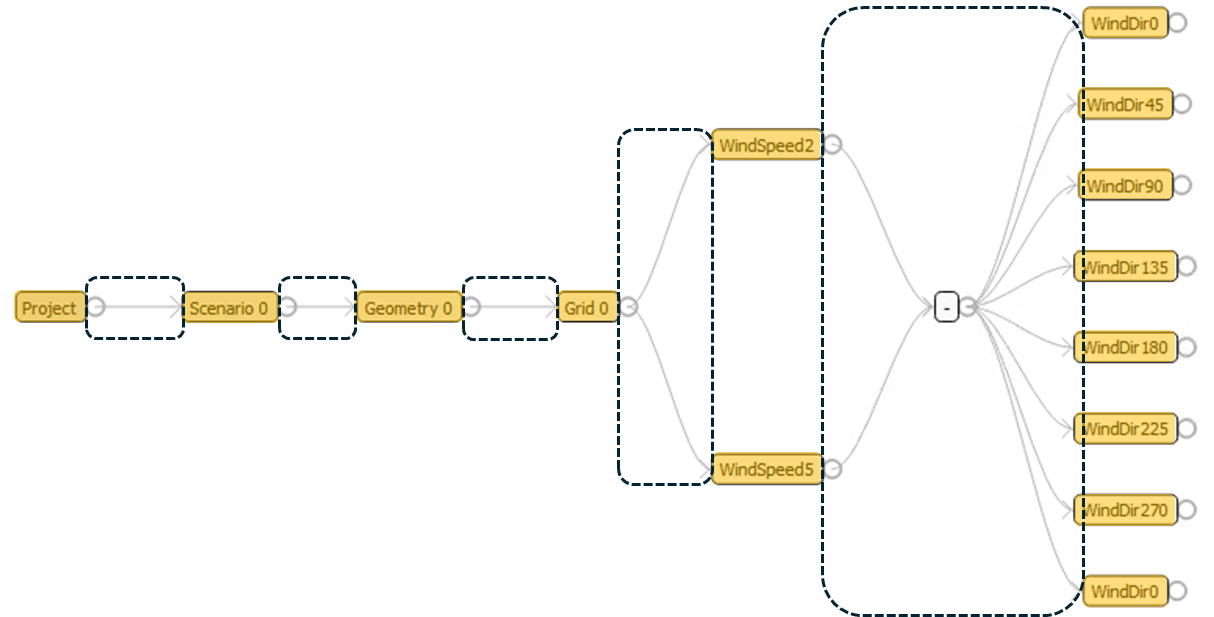
Graph view showing nodes (highlighted in orange) and connectors (highlighted in dashed boxes)
Graph view layout
Within the graph view there are several options to visualise the scenario tree which may be useful for projects with large numbers of scenarios.

Graph view layout options
Graph elements: nodes and connectors
The Graph View displays variations of scenarios in graphical form using nodes and connectors:
Root node: contains information about the project, output path and input path.
Scenario node: relates to the base scenario and contains information and scenario settings. Scenario settings can be edited within Node Properties.
Geometry node: points to the geometry file (e.g., co000000.geo), can be cloned to create scenarios with different geometries. By default, the geometry associated with the base scenario will be loaded.
Grid node: relates to the simulation grid, can point to the base scenario grid or can be generated for each scenario by loading an autogrid configuration. By default, the grid associated with the base scenario will be loaded.
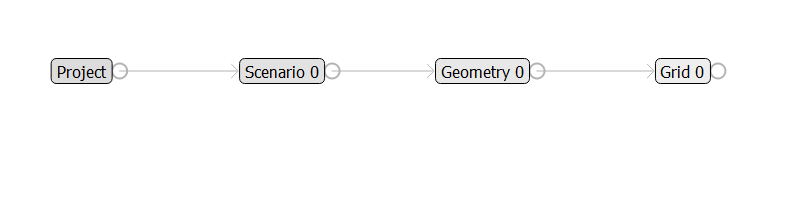
Graph view showing default project, scenario, geometry and grid nodes.
Additional nodes: can be added in order to create scenarios with different settings and properties such as cloud dimensions, cloud position and wind.
Generic nodes: can be used to vary other parameters not included in the main list of additional nodes (see Adding data manually section).
Connectors: are used to connect nodes together. Selecting multiple nodes and adding a connector will create a common connection point for all selected nodes. Accessed via right-click -> Add -> Connector.
Clone: clones of nodes can be created via right-click -> Clone. Clones allow for creation of multiple scenarios where the selected property can be varied.
Note
By connecting groups of nodes together, each combination of nodes will be output as a separate scenario, allowing a large number of simulations to be created quickly and easily.
Other operations in graph view
Suspend: suspended scenarios are not created upon exporting.Revive: reverts suspended scenarios so they can be exported.
Data from scenario: imports data from an existing scenario file.
Information: presents information on the number of leaves and nodes in the scenario tree.
Delete: deletes nodes or connectors
Highlighting / selecting scenarios: nodes can be selected individually or by clicking and dragging over several at once.
Table view
Presents all scenarios within the project in a table format. Columns can be added to display and sort by different scenario settings (right-click -> Table Columns). Selecting a scenario in Table View highlights the same scenario in Graph View and displays it in Node Properties.
Scenarios are exported by selecting Export all scenarios or Export selected scenarios.
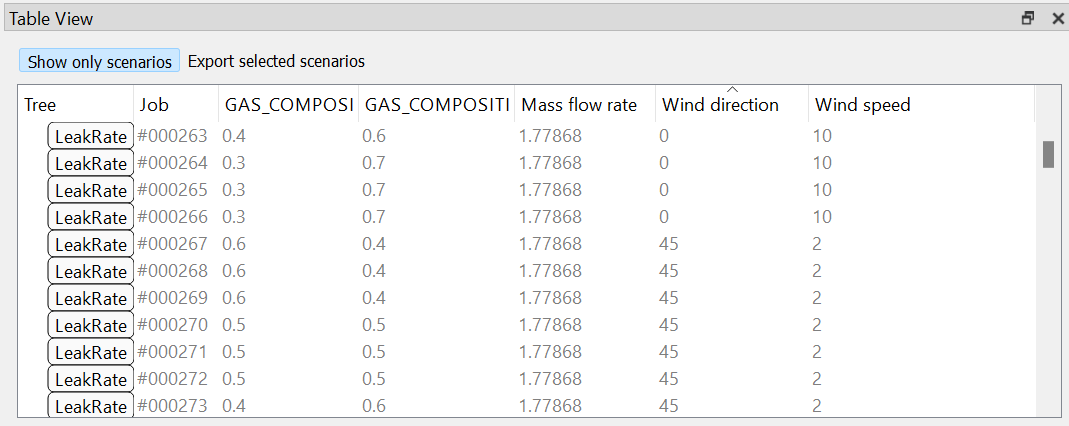
Table view showing properties based on the defined nodes
3D view
3D view provides a visualization of geometries, grids and scenario items added in the multiscenario project. Drop-down lists for geometries and grids defined in the project are present at the top of this view. Scenario items to be displayed can also be selected.

3D view in the multiscenario window
Node properties
In this view node data like name, id, etc. can be set. It is also possible to add scenario data here.
Selecting the scenario node brings up a list of the scenario settings. Advanced settings can also be displayed (accessed via right-click)
Add – allows scenario data to be added
Delete – deletes scenario data
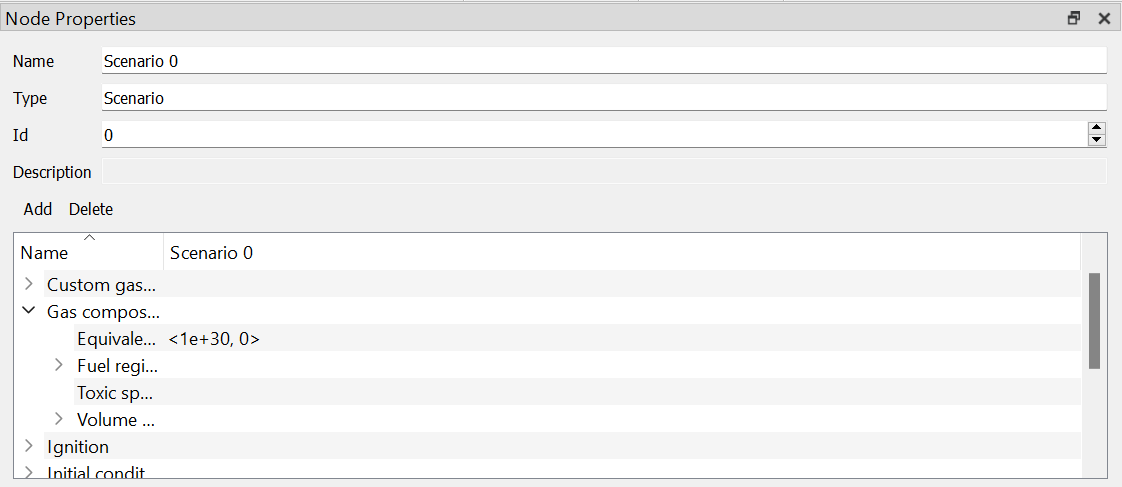
Node properties in multiscenario
Adding data manually
Select one or more existing nodes, right-click -> Add -> Generic. Then in Node Properties Add and choose a property category in the drop-down menu. Select the category again, then Add and choose a property. In this way any scenario setting property can be added.
Data can also be imported manually from an existing scenario by right-clicking on the node and selecting Data from Scenario. In this method, all scenario settings are pulled through, hence those not required should be deleted within Node Properties.
Exporting scenarios
Scenarios are exported by selecting Export all scenarios or Export selected scenarios in the Table View. Suspended scenarios are not exported.
Scenarios are exported to the defined output path. This can be changed in the root node.
There is also the option to run the porosity calculator upon export of scenarios. This can be accessed via Options-> Preferences -> Multi Scenario -> check Run porosity calculations on export.
Autogrid integration
By default, a project will use the grid file associated with the base scenario. However, this can be changed to implement the autogrid function for each scenario. This is especially useful for projects where settings such as cloud and leak locations and sizes are varied across scenarios.
To use autogrid across the project scenarios:
Select the grid node in Graph View
In Node Properties enter AUTO into the grid file field
By default, autogrid will calculate a grid based on the scenario settings according to FLACS grid guidelines.
For scenarios which require specific grid requirements, autogrid configurations can be loaded from a configuration file by:
Select and right-click the grid node in Graph View
Select Load autogrid config… and navigate to the required configuration file
The user should consider whether these options are suitable for their application. Using the default autogrid does not allow for the user to set the regions of interest, boundary locations or grid lines at significant locations or pieces of geometry.
However, when loading from an existing autogrid configuration the grid cell sizes around leaks or clouds do not change from the values associated with the existing simulation. Hence, if the project requires scenarios with different gas clouds or leaks, different grid nodes should be used with appropriate configuration files.
Another solution is to use autogrid without loading an existing configuration and adding grid lines at important pieces of geometry and at the maximum extent of the grid. This will also allow autogrid to accommodate for different gas clouds or leaks.
Making changes to the base scenario
If the base scenario settings need to be modified after a multiscenario project has been created, the settings can be altered within multiscenario itself. However, it should be noted that these changes do not alter the base case scenario file and loading data from a scenario file will overwrite any changes made within multiscenario.
Alternatively, changes to the base case scenario can be made in CASD and then reloaded into the multiscenario project. This should maintain parity between the project and base case scenario settings.
Examples
A number of examples are provided to demonstrate multiscenario functionality here.
Was this article helpful?