- 03 Jul 2024
- 2 Minutes to read
Meteorological distribution
- Updated on 03 Jul 2024
- 2 Minutes to read
What is a meteorological distribution?
The risk associated with an accidental release scenario at a specific location is highly influenced by the probability of the wind blowing in different directions towards vulnerable areas. Meteorological distribution data can be defined in the tree node ‘‘Meteo data,’’ which can be found in each Calculation set. This data will be applied for the entire calculation set:
.png)
The meteorological distribution consists of:
Atmospheric stability: Definition of the Pasquill stability classes expected to occur during a year and their corresponding wind speeds (e.g., D5 or F2).
Probabilities:
Probability of those atmospheric stability classes occurring over the span of a year.
Probabilities for all wind directions occur for those atmospheric stability classes (a combination of wind speed and Pasquill stability class).
This data is applicable for the region where the scenarios are defined and is typically provided by meteorological stations at airports, harbours, etc.
Working with meteorological distributions
Selecting predefined meteo distribution
RISKCURVES includes a short list of predefined meteorological definitions at various locations within the Netherlands, Singapore and Brazil. The meteorological data is presented in windrose or table format.
.gif)
Customizing default meteo distribution
In the menu bar press <Edit>
Select ‘‘Options’’ from the dropdown menu.
In the Options window, select weather definition from the list:
.png)
Now the weather class will be always pre-selected when opening a new project file:
.png)
Adding a new meteo distribution
To add meteorological data specific to your location, use the meteorological editor.
Press the <browse button> in the Meteo data input panel.
.png)
Open the meteorological editor.
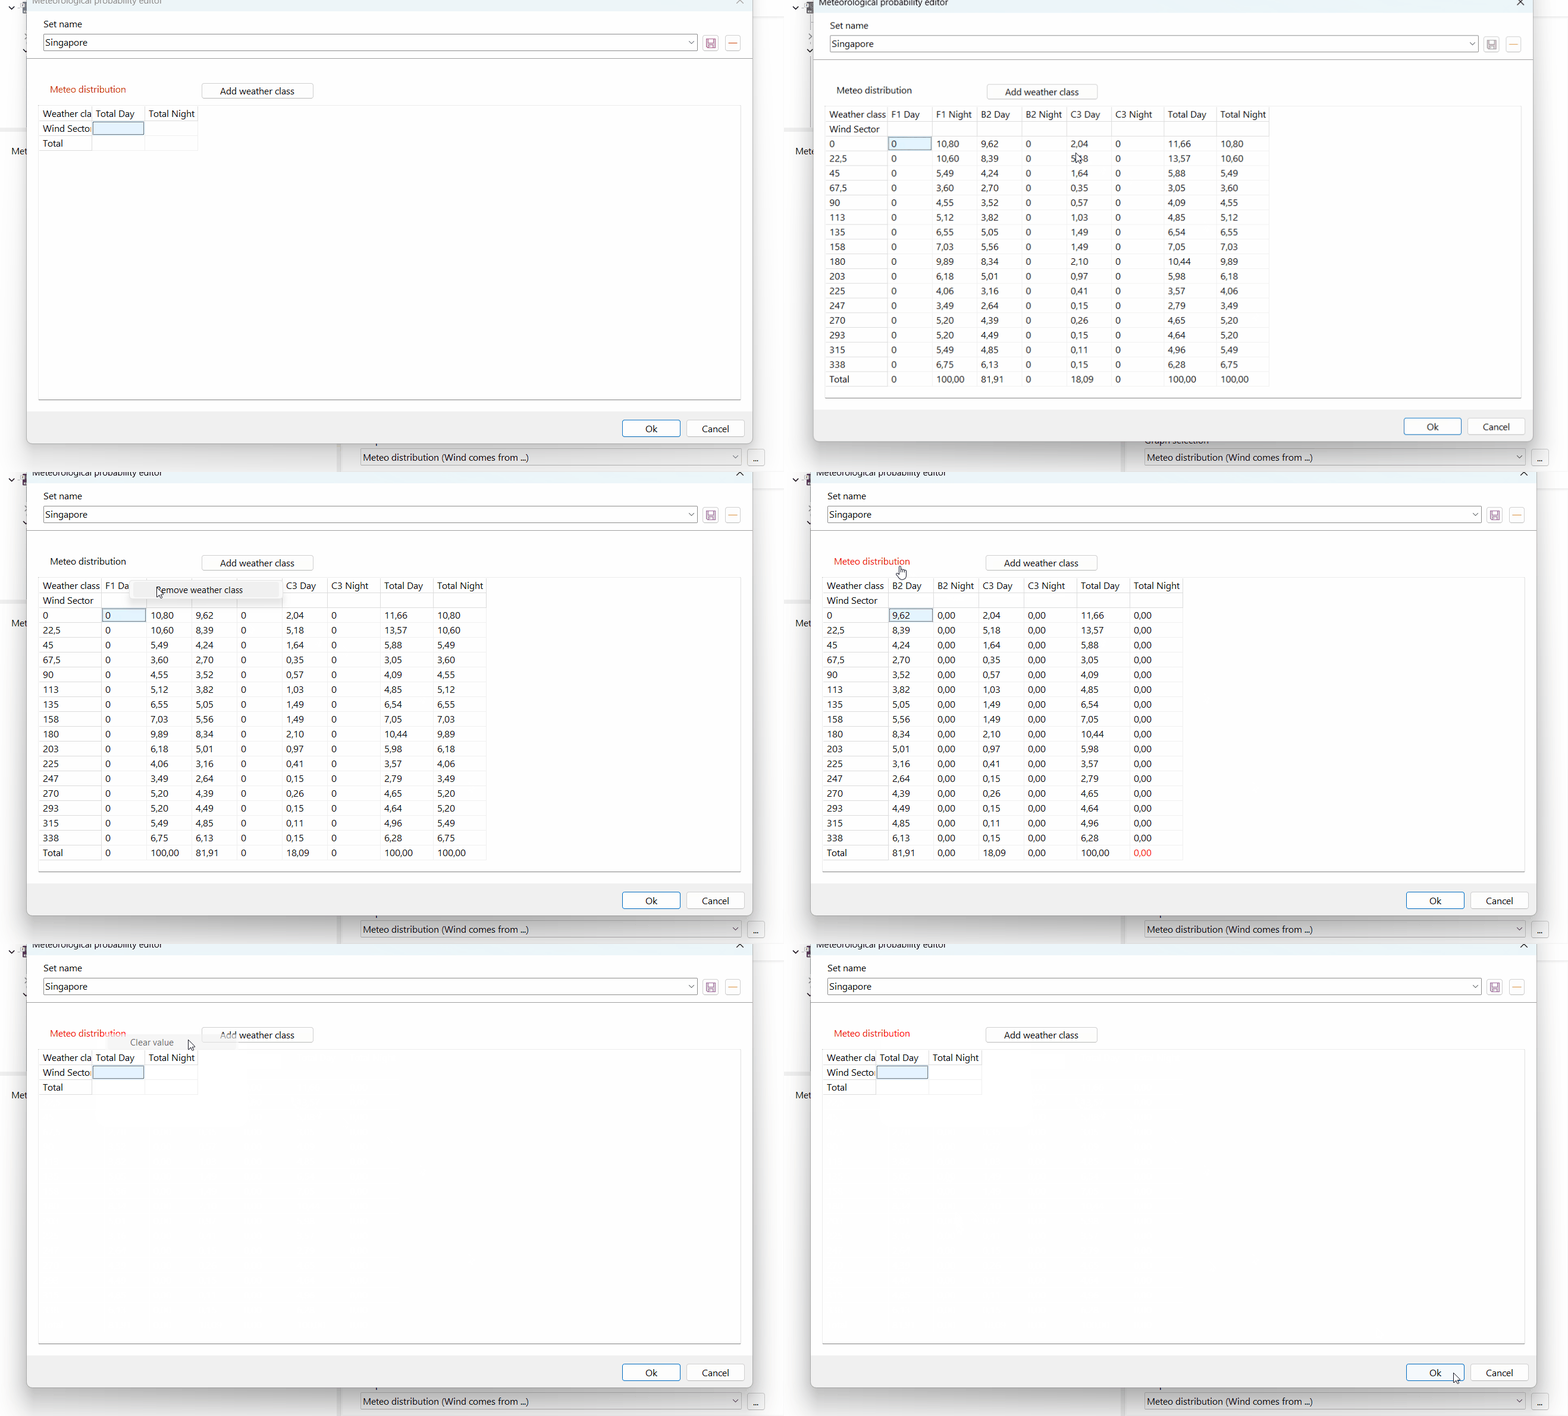
Delete the meteo distribution by right-clicking at ‘‘Meteo distribution’’ and selecting ‘‘Clear value’’ or delete columns for one weather class by right-clicking the columns and selecting ‘‘Remove weather class’’.

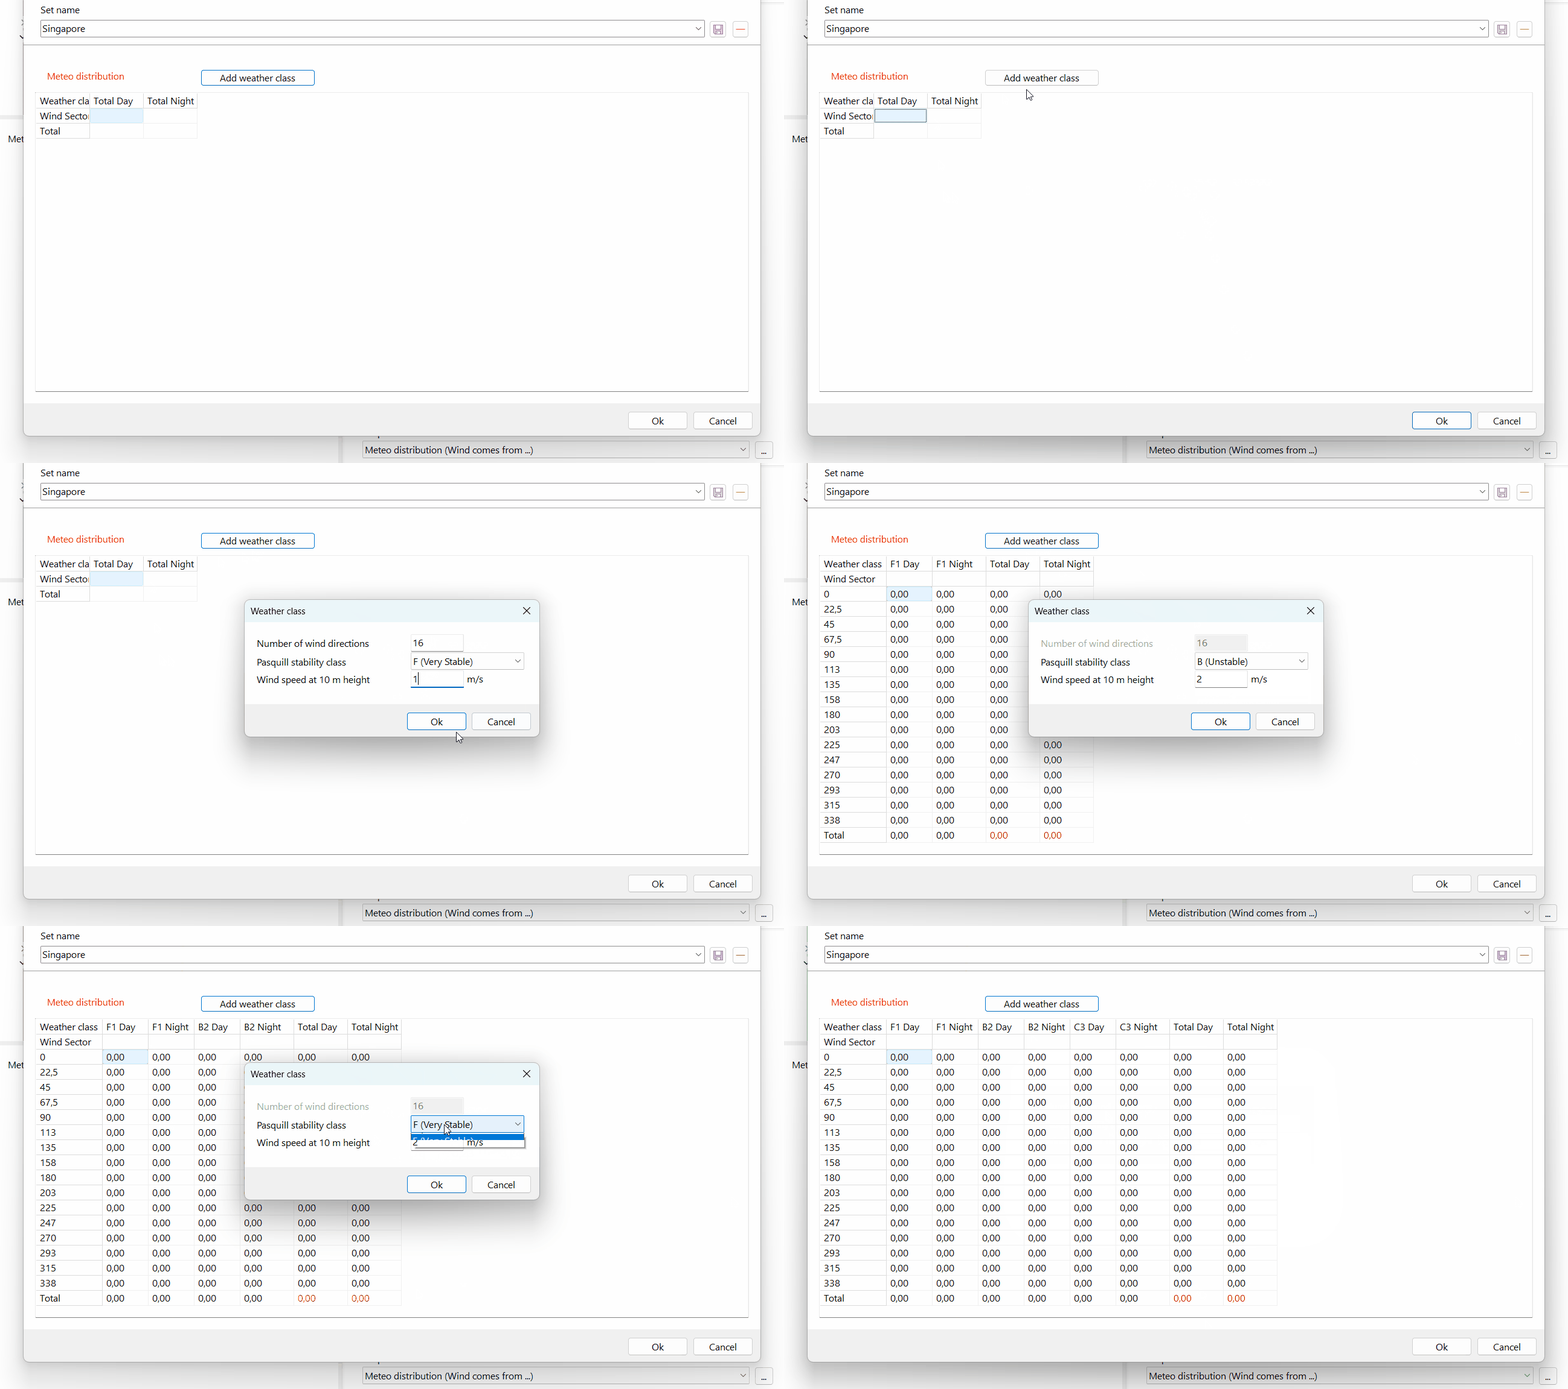
Press <Add Weather Class> to add two colums (day and night) in the table.
Define your weather class columns (number of wind directions, Pasquil stability class, wind speed at 10 m height).

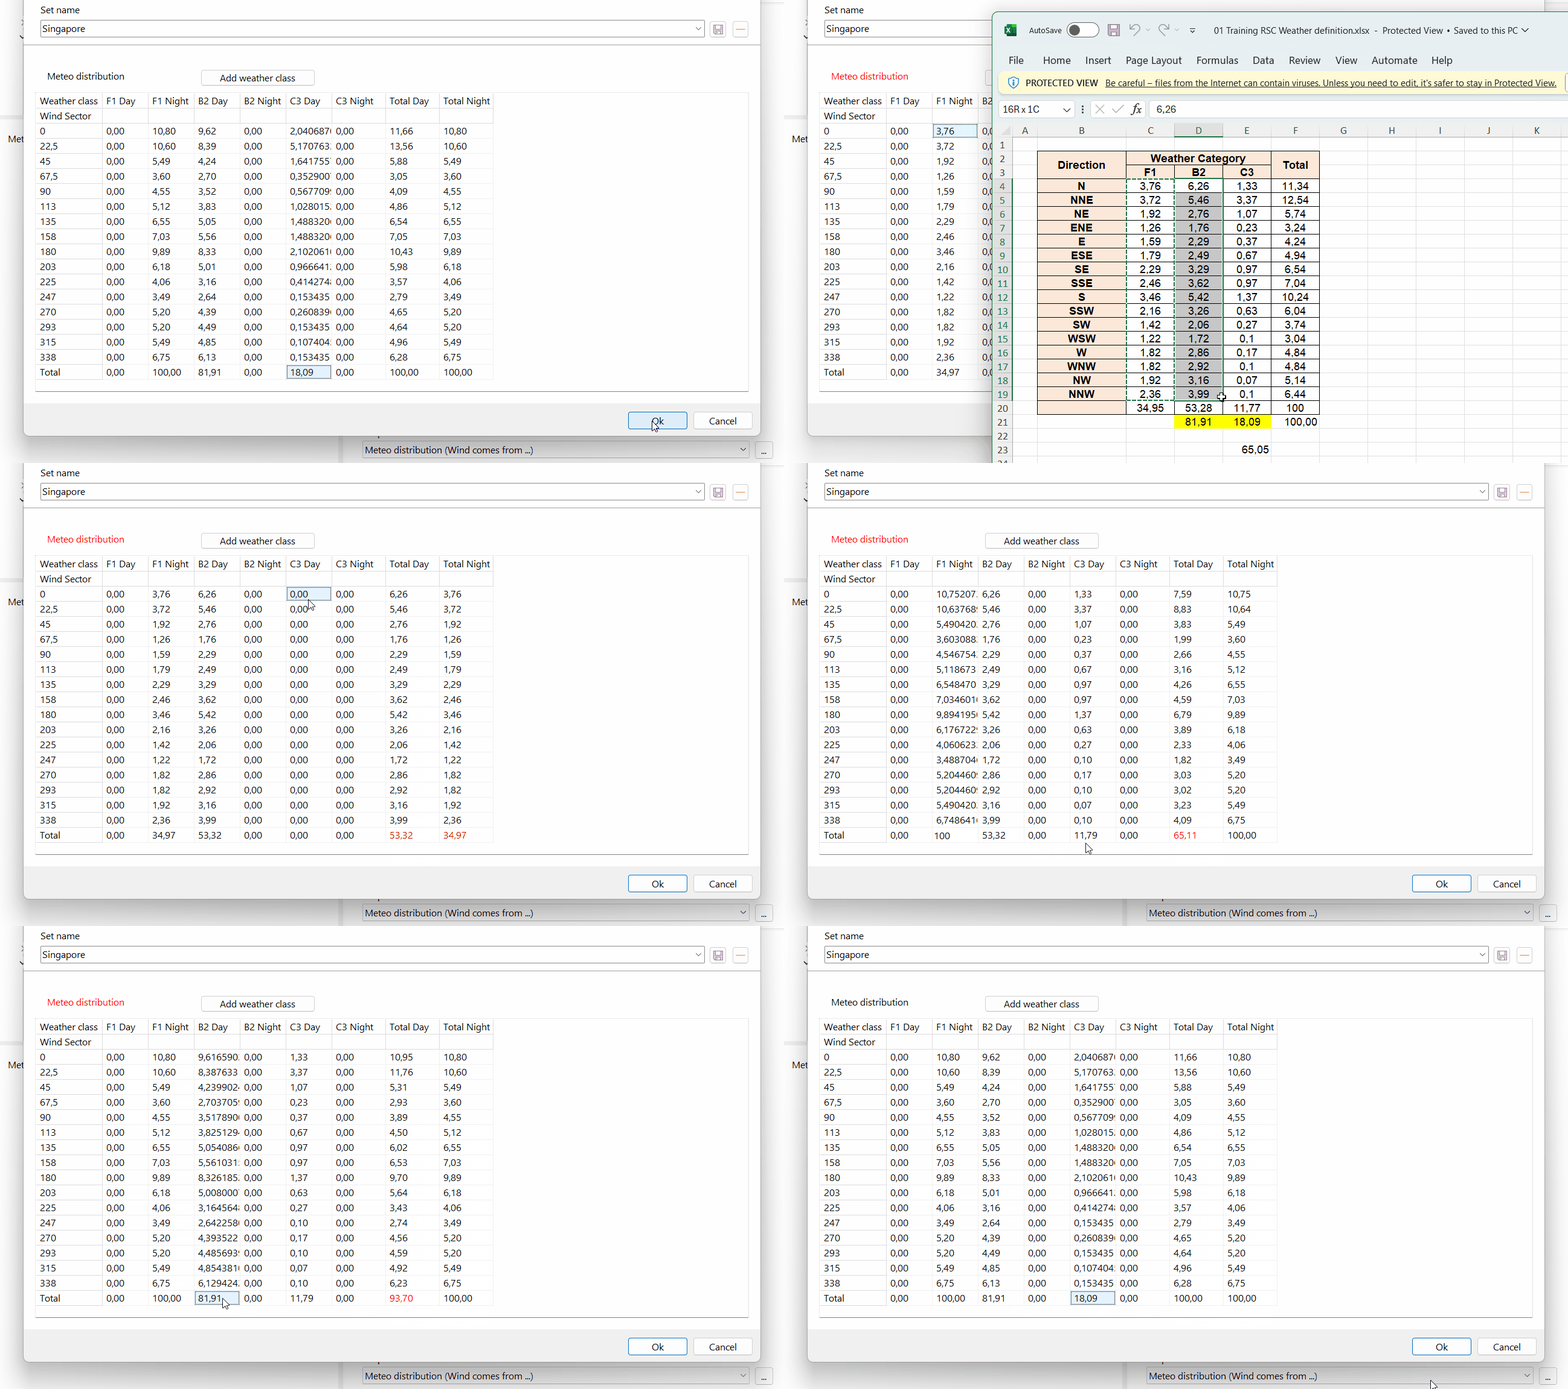
Copy and paste probabilities into cells or entire columns.

Note
The sum of all-day and all-night definitions should be 100% for day and 100% for night. If this condition is not met, a red Meteo Distribution indication will be shown, and the total day or total night might turn red, indicating invalid values. To fix this the total occurring probability for a column can be modified without altering the current wind direction distribution for the weather class.
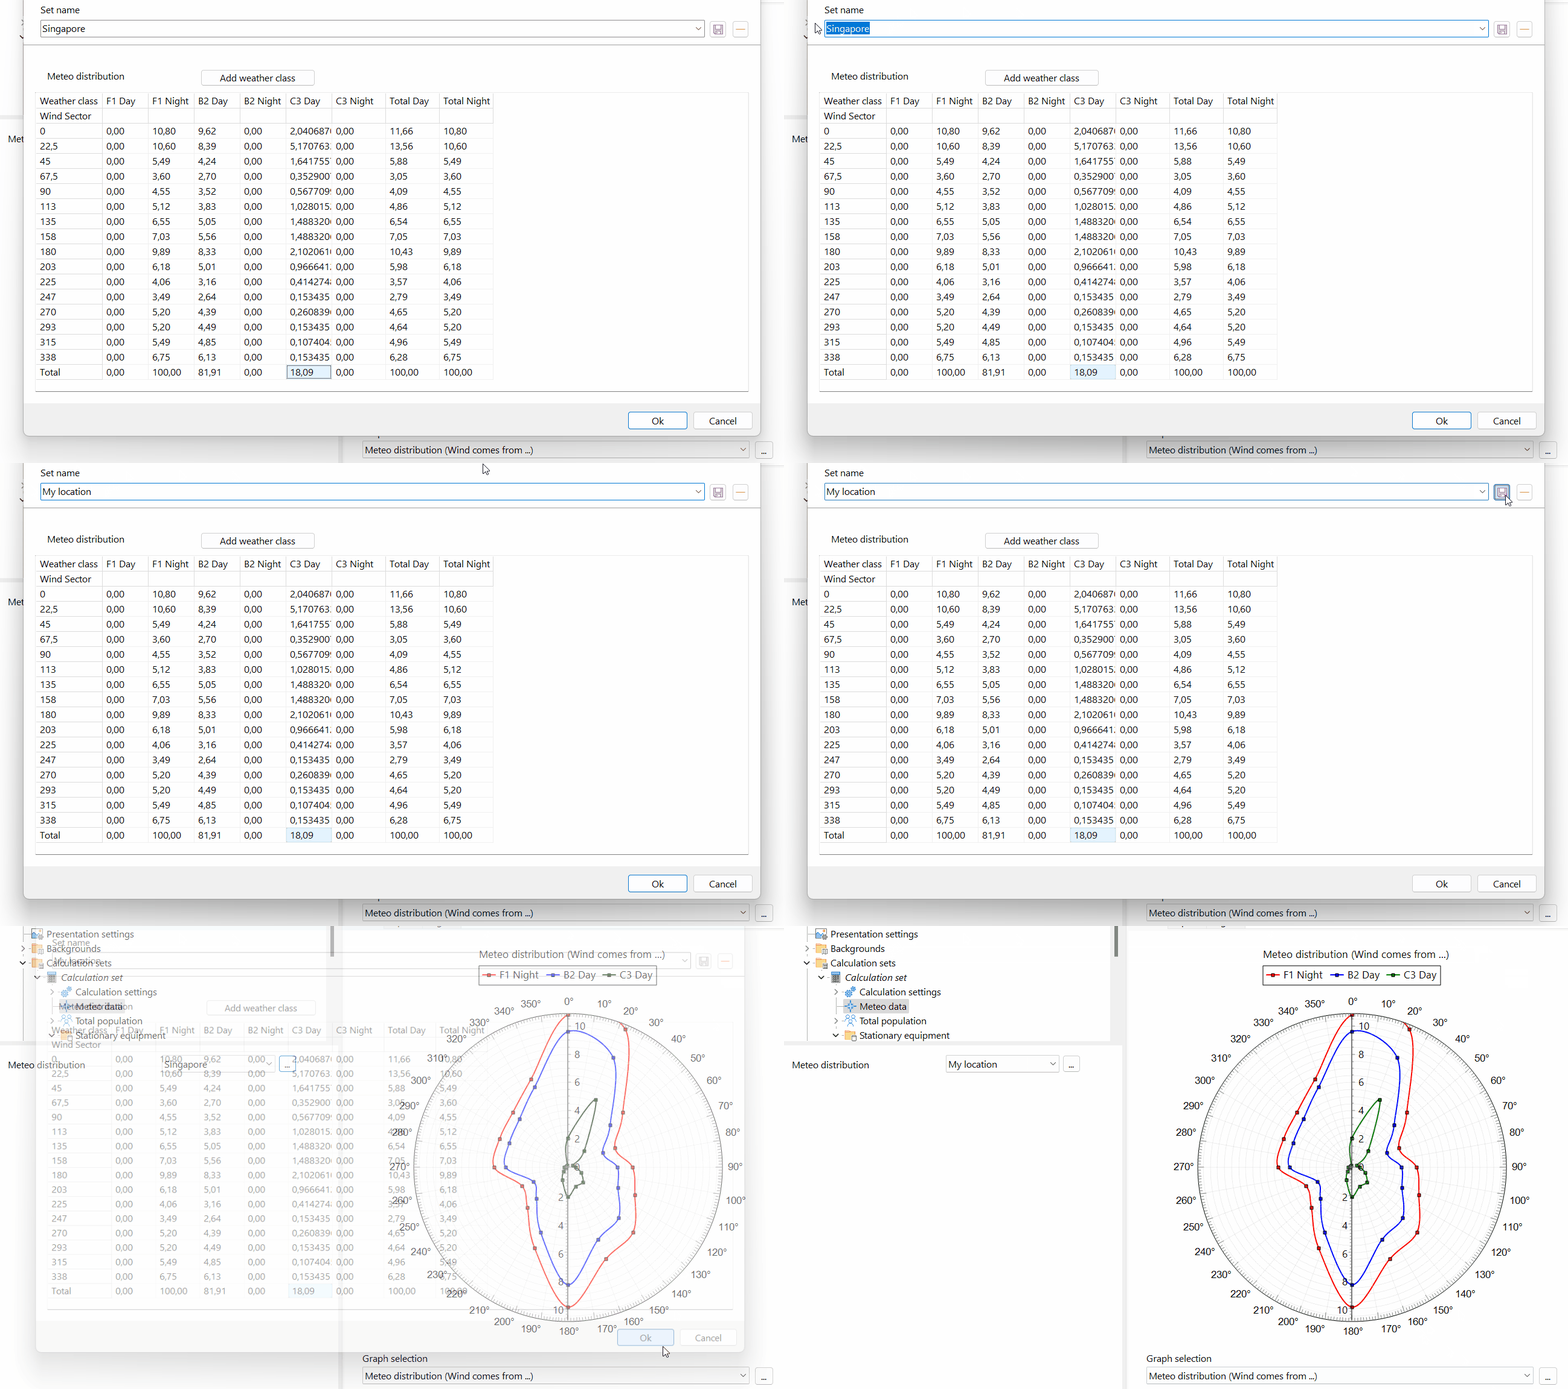
For traceability, set the name of the location for this data.
Press save.

Once new meteo data has been added for the corresponding meteo station, these locations can be selected in the meteo data project node.
By following these steps, you can ensure that your RISKCURVES project accurately reflects the meteorological conditions relevant to your location, providing more precise risk assessments.

