- 19 Jul 2024
- 2 Minutes to read
How to define 3D congested areas
- Updated on 19 Jul 2024
- 2 Minutes to read
Defining a 3D congestion area in EFFECTS is essential for evaluating the potential for vapour cloud explosions when a flammable cloud is confined. The software calculates the overlap of the flammable cloud with the congestion area on the map, providing results such as explosive mass and blast curve strength. Follow the steps below to define and link a congestion area.
Defining a congestion area
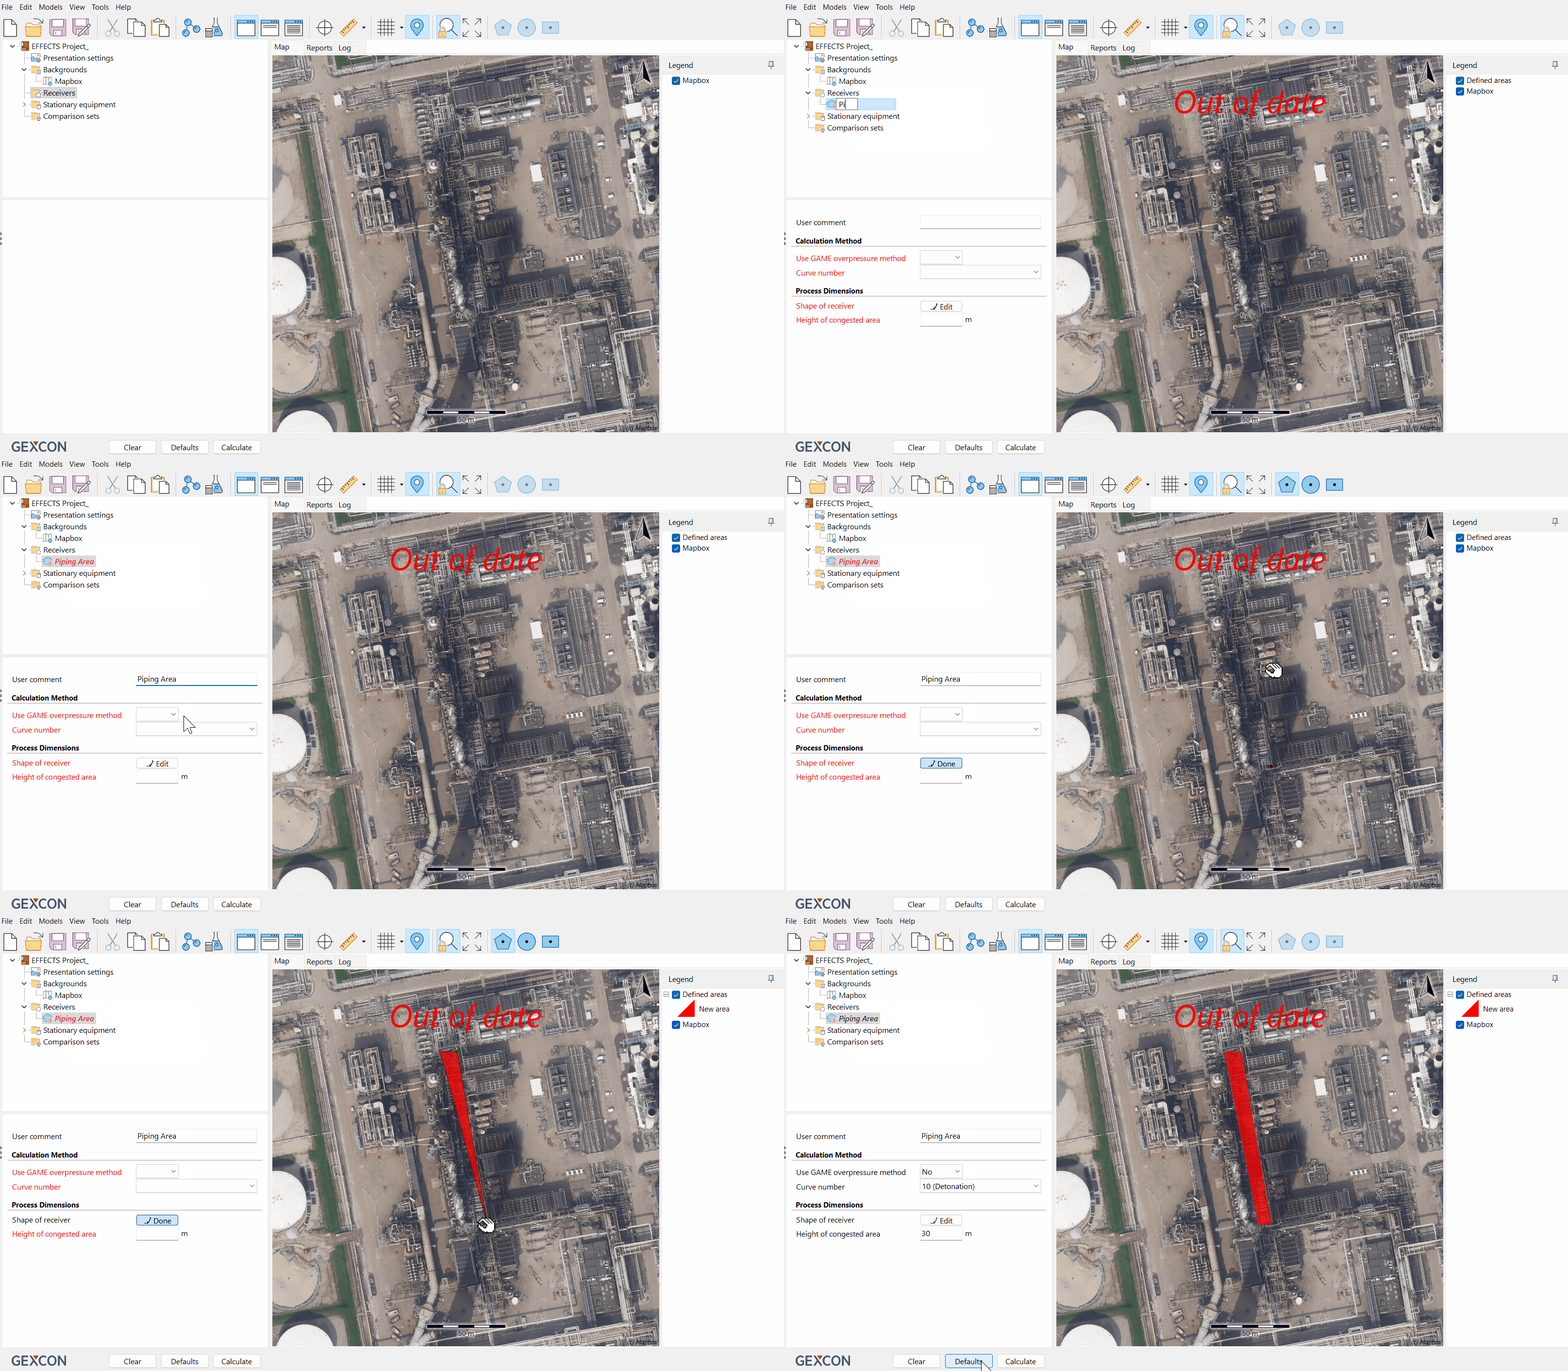
Navigate to the desired location
On your map, locate the area where you want to define your congestion area.
Add congestion area
Right-click on the "Receivers" node of the project tree.
Select "Add congestion area" from the context menu.
Populate required inputs
Click on the newly added congestion area node to your project tree.
Fill in the required inputs for the congestion area.
Define the shape of the congestion area
Click "Edit" next to the "Shape of receiver" input.
Define the area by clicking on the map to outline the desired congestion area. The area will be highlighted in red as you click.
Once the area is outlined, click "Done to finalise the shape.

Linking the congestion area to a flammable dispersion model
Once the congestion area has been defined, this receiver can be linked to a flammable dispersion model. To do so, the steps below can be followed:
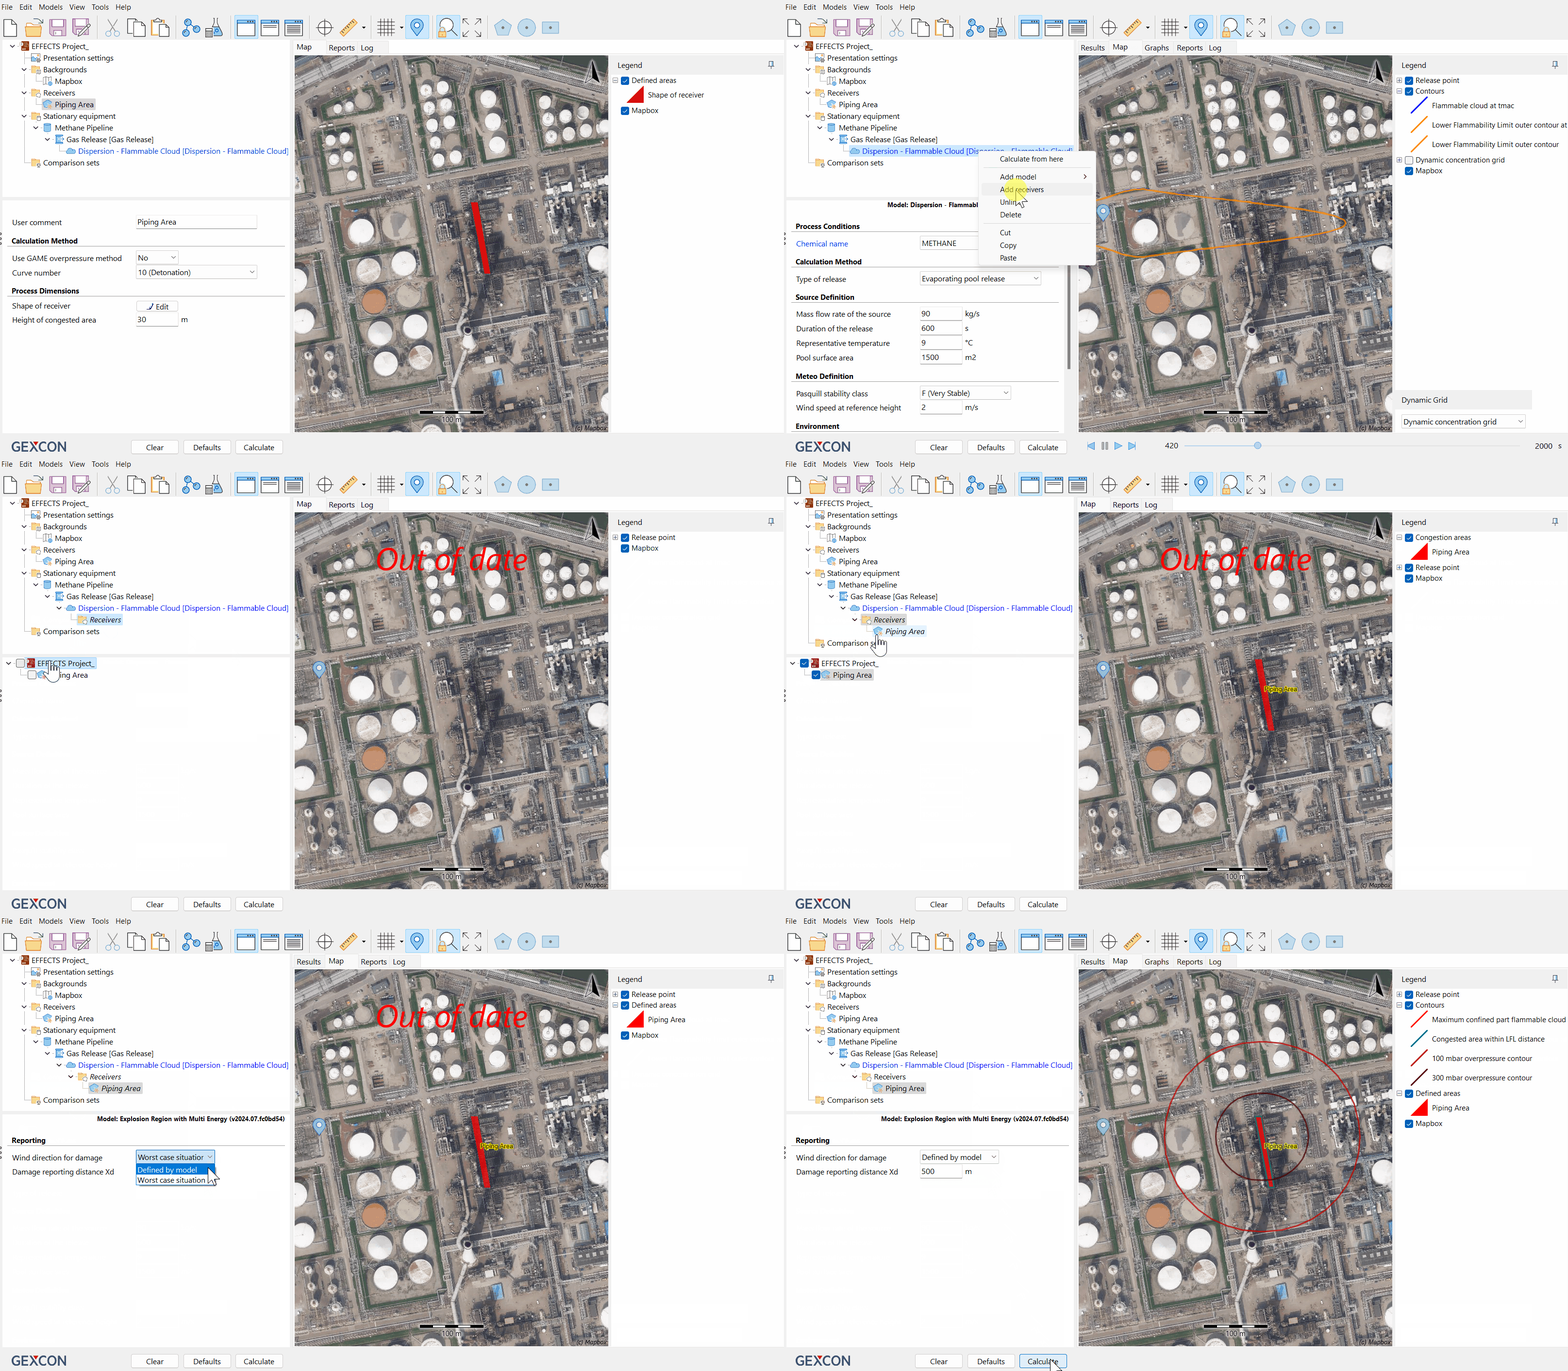
Select the associated equipment
Navigate to the "Stationary Equipment" node in your project tree.
Select the equipment associated with the release point that you want to link to the congestion area.
Add receiver to the model
Right-click on the chosen model (in this case "Dispersion - Flammable Cloud")
Select "Add receivers" from the context menu.
Click on the "Receivers" folder that has just been linked to the model.
The receiver(s) will be listed in the section below the project tree.
Select the congestion model you would like to evaluate, by clicking the box next to the defined congestion area.
Configure damage reporting
Choose the "Wind direction for damage".
The default option is "Worst case situation", which will force the model to choose whatever wind direction leads to the worst-case scenario (with the worst damage consequences).
The alternative option is "Defined by model" which will use the wind direction indicated as an input of the model the congestion area has been linked to.
Define your "Damage reporting distance Xd".
Calculate results
Click "Calculate" to view the results.

By following these steps, you can effectively define and link a congestion area in EFFECTS, ensuring comprehensive assessments of potential vapour cloud explosions and other hazards.
Interpreting the results
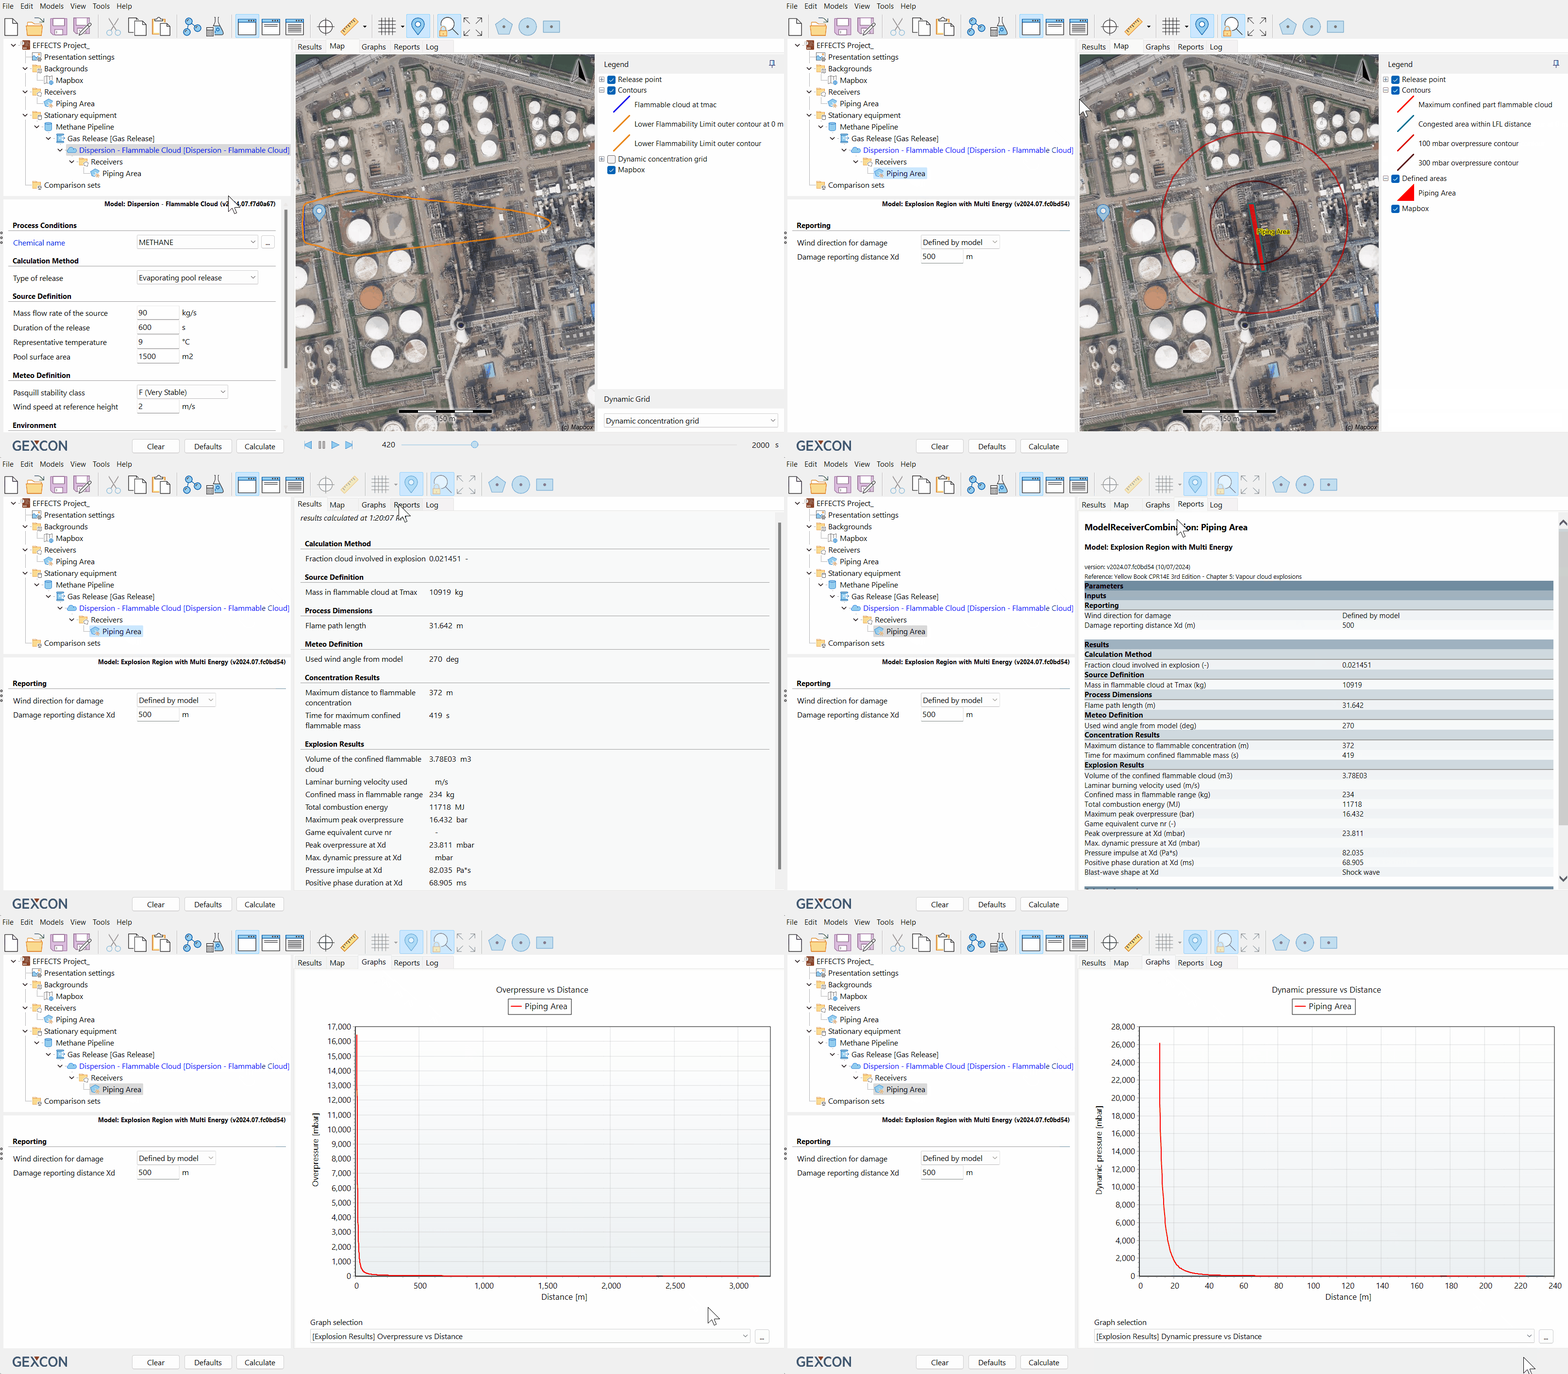
EFFECTS allows for efficient interpretation of the results by providing a clear visual representation of the impact of the congestion area as well as the specific data. Evaluation of the consequences that the congestion area has on the selected model can be done by the following steps.
Select the congestion area: Click on the congestion area that is linked to the specific model in the project tree
Evaluating the contours: The map view will show the related contours that display the impact that the congestion has on the scenario.
Evaluating the results: The results page will provide the consequence analysis results overview that the scenario had on the vulnerable area. The number of fatalities for the applicable and various maximum or peak results that are applicable to the scenario will be provided.
Evaluating the graphs: The graphs page will display the available graphs showing various pressure measurements in relation to the distance.


