- 30 May 2024
- 2 Minutes to read
Graphs
- Updated on 30 May 2024
- 2 Minutes to read
The Graphs tab in the user interface presents all graphs that can be calculated by the model. The number of graphs available can vary depending on the model, but typically these graphs illustrate the behaviour of a result parameter over time or distance.
Zoom in and Zoom out
Drag method: Hold the left mouse button and drag the mouse from top left to bottom right to zoom in. Hold the left mouse button and drag from bottom right to top left to zoom out.
Mouse wheel: Scroll the mouse wheel to zoom in and out.
Graph selection
Only one graph can be visible at a time. To view other graphs, use the Graph Selection Box. Pressing the down arrow will display a list of all available graphs (see below). For combined LoC scenarios, the result name is followed by the model name that produced this result.
Change axis units
Right-click on the axis to change its units, similar to other numerical values in the interface.
Watch the animation below to see all these 3 functionalities explained above in action.
.gif)
Cross-hair and Ruler
Both functions can be accessed from the toolbar:
Cross-hair: Displays the current X and Y values of the mouse cursor.
Ruler: Measures the distance between specific points on the graph.
Watch the animation below to see these functionalities in action.
.gif)
Edit, Copy, Freeze, Edit, Export
Right-clicking on the profile graph opens a pop-up menu with the following:
Copy: Puts a high-resolution copy of the current view on the clipboard.
Freeze: Creates a "clone" of the current graph in a new window.
Print: Opens a print preview, allowing you to resize and modify margins.
Properties: Invokes the build graphic editor, providing access to all graph settings, including titles, scales and legend placement. The export tab within the properties editor allows for further customisation.
Export: Saves the graph content, either as an image or as the data points used in the graph. Available formats include:
Values: Excel, CSV, GeoJSON w
Images: EMF, BMP, JPG, PNG.
Watch the animation below presenting these functionalities in action.
.gif)
.png)
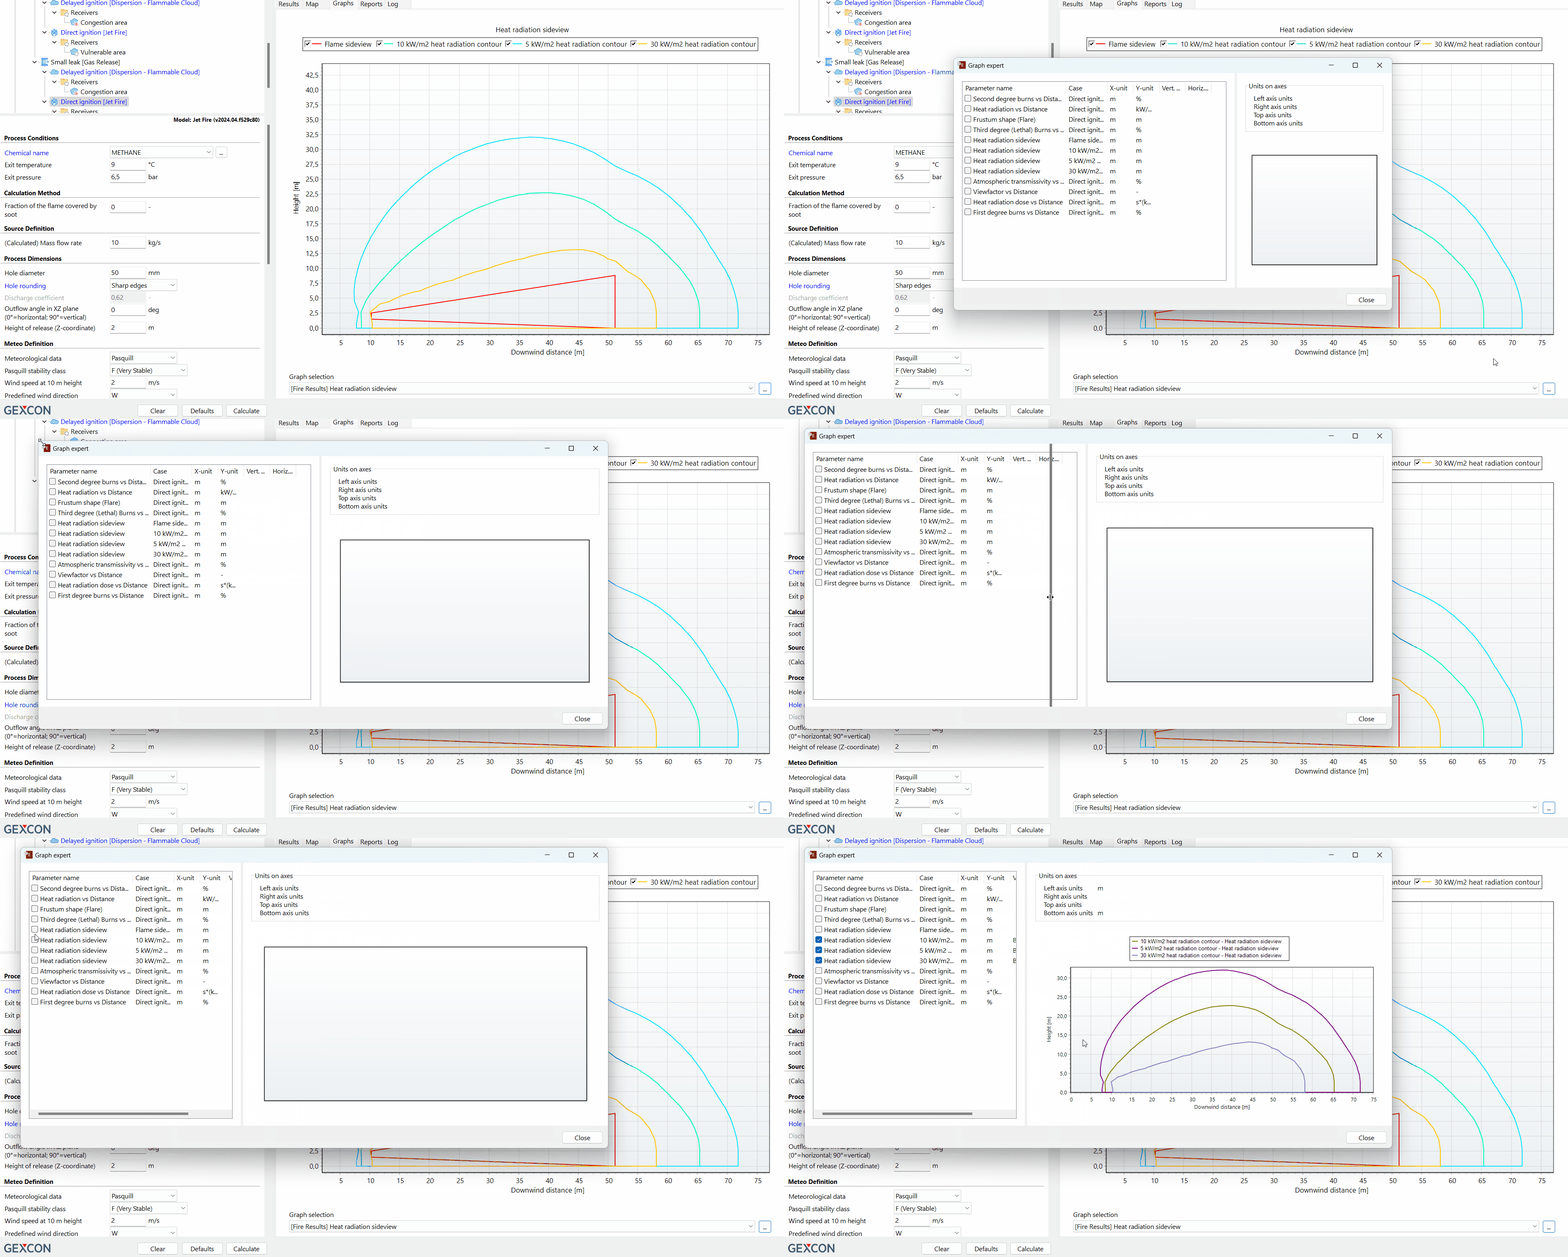
Graph expert button
The small button next to the profile selection box enables access to the "Graph expert". This feature allows the selection of multiple graphs (profiles) or graphs from multiple calculation sessions. Pressing this button opens a new window listing all currently available profiles on the left side, where you can "tick" any graph to view it.
Watch the animation below presenting this functionality.

By utilising these tools and features, you can effectively analyse and interpret the graphical data generated by your models in the user interface.

