- 13 Jun 2024
- 2 Minutes to read
Population distribution
- Updated on 13 Jun 2024
- 2 Minutes to read
Defining a population distribution is essential for conducting Societal Risk Calculations in RISKCURVES. The population is defined for the entire calculation set and can be imported or manually added. Note that defining a population distribution is only required for Societal Risk calculations.
Here is a step-by-step guide on how to define a population distribution:
Adding population
Select the <Total population> node within the Calculation set.
Right-click on the <Total population> node.
Choose either <Import Population> or < Add Population Polygon>.
Importing population
A population grid can be imported from various file formats such as ASCII-based grids, ESRI grid formats (provided by local authorities), or from a previous RISKCURVES v7 .POP file. Apart from grid-based input files, the population can also be created from polygons loaded in a shape file.
To import population into RISKCURVES:
Open the population import wizard
Select the <Total population> node within the Calculation set.
Right-click on the <Total population> node.
Select <Import population>, which will open Population Import Wizard.
Select population grid or population polygons
Choose between importing a Population Grid (cell-based distribution) or Population Polygons, depending on the information you have.
Tip - Importing Population Polygons
Translate highly detailed shape files (buildings) into a grid. When using "region based" shapes, import these as separate polygons.
Chose fle type
Select a file type (ESRI grid, ASCII / CSV table, or a Shapefile).
Select and import data
Choose the population distribution files.
Proceed by pressing <Next>.
Define how your imported data is structured to make sure is readable (see animation below).
Define grid boundaries
After importing the file, specify the boundary definitions of the grid by defining the lower left and upper right corners of the grid (only if needed).
.gif)
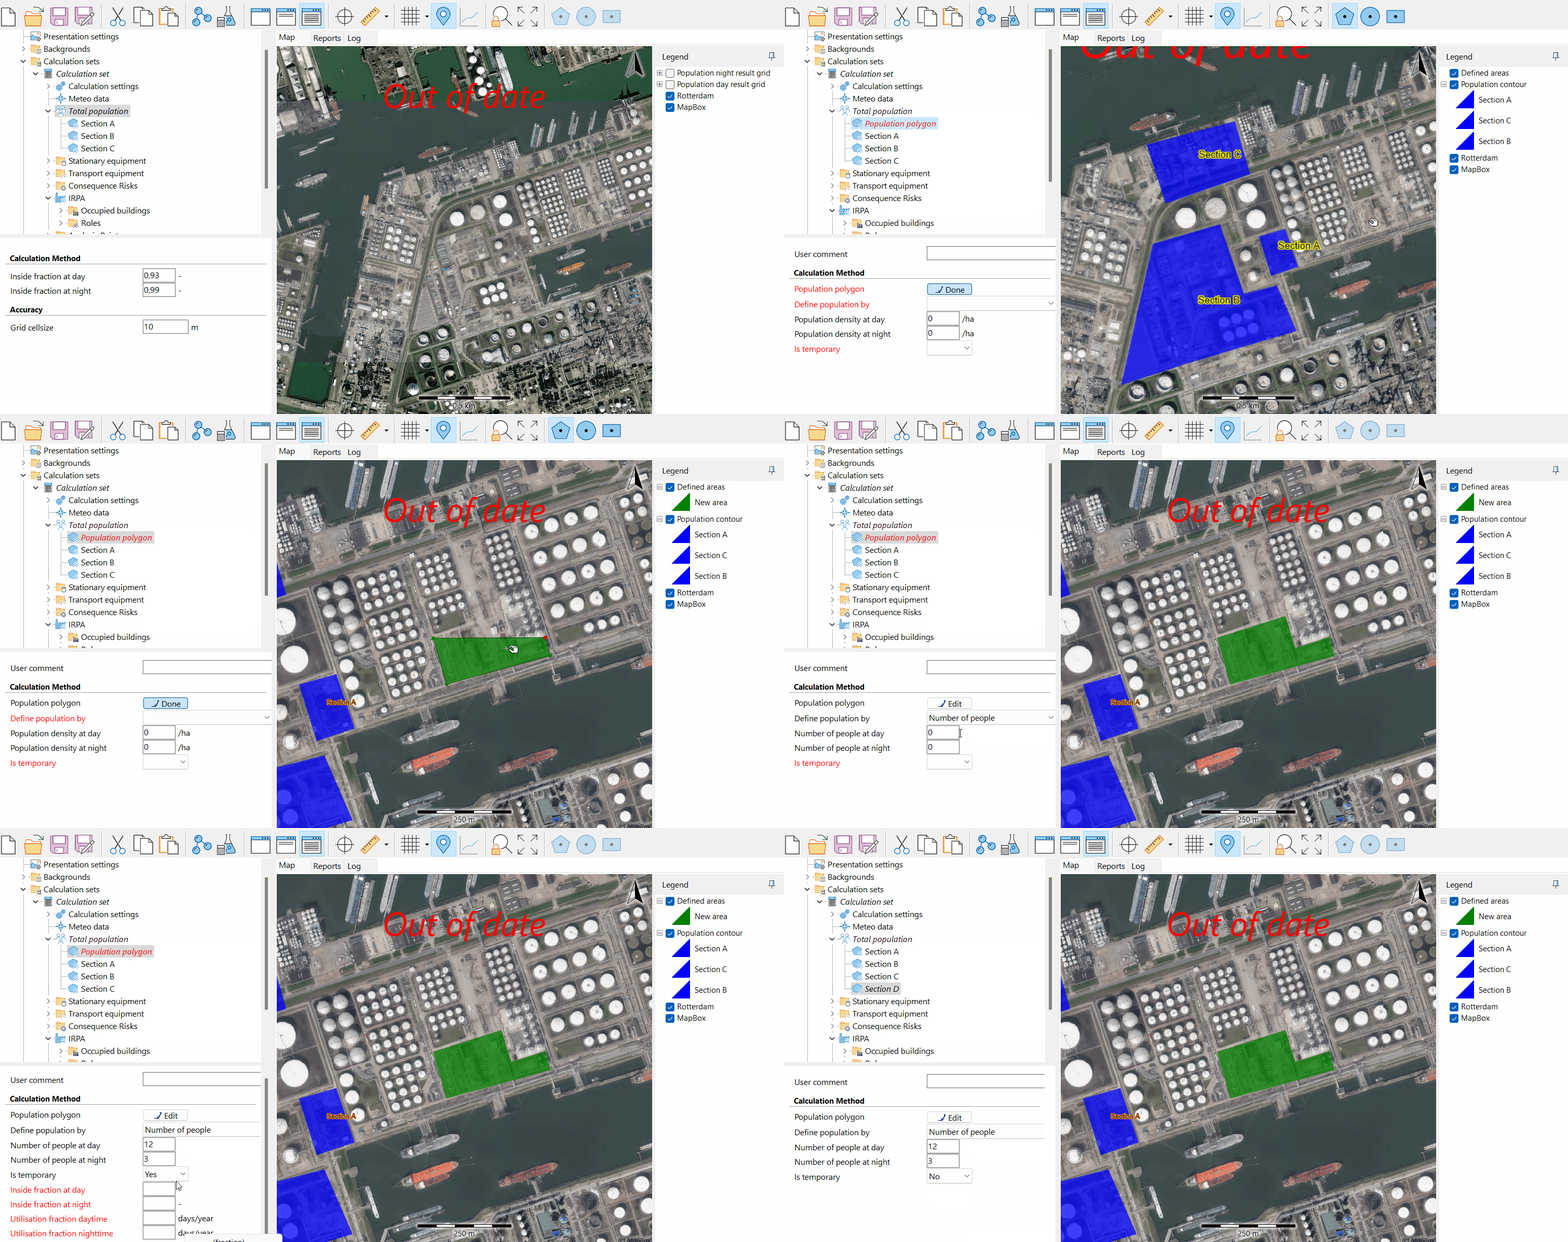
Adding population polygons
When adding population polygons manually:
Create a new tree node
Select the <Total population> node within the Calculation set.
Right-click on the <Total population> node.
Press <Add Population Polygon>, which will create a new tree node with an input panel.
Define polygon shape
In the input panel, select the <Edit> button.
Pinpoint coordinates on the map to define the shape of the polygon.
Click the <Done> button once the shape is finished.
Enter population data
Specify the number of people within this area during the day and night.
For standard usage, select “is temporary” as NO, unless using temporary population (such as population present at a concert hall or football stadium, which are only present a few times a year).
Note - Temporary polygons
Using many temporary polygons (more than 10) close to one another, which can be exposed to the same lethality footprint of a single event, can be time and memory-consuming due to the need to evaluate all potential combinations.
Name the polygon
Give the polygon a specific and recognizable name by double-clicking on the text “population polygon” or pressing F2.

By following these steps, users can accurately define population distributions within RISKCURVES, which is crucial for comprehensive societal risk assessments. Properly defining the population ensures that risk calculations reflect realistic exposure scenarios, aiding in effective risk management and safety planning.

