- 23 Oct 2024
- 2 Minutes to read
Cumulation sets
- Updated on 23 Oct 2024
- 2 Minutes to read
Cumulation sets in RISKCURVES are essential tools for aggregating results from different risk sources, providing comprehensive Societal Risk (SR) or Individual Risk (IR) analyses. This feature is particularly useful for evaluating combined risks from multiple pieces of equipment or scenarios, allowing users to distinguish between different risk profiles such as flammable hazards versus toxic scenarios, or specific types of equipment.
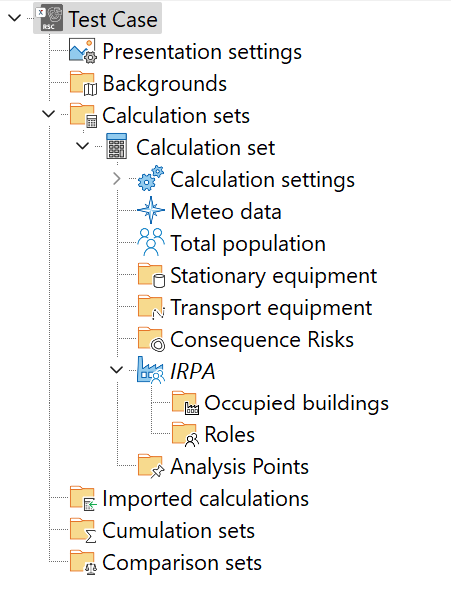
The cumulation set is found at the bottom of the project tree, above the comparison set node. The cumulation set allows users to include or exclude specific scenarios, calculation sets, or imported calculations through a list of checkboxes.

Cumulation set in RISKCURVES's project tree
Creating and using cumulation sets
Add a cumulation set
Right-click on the "Cumulation sets” node in the project tree.
Select <Add cumulation set> from the context menu.
Rename the cumulation set
Select the newly created cumulation set.
Press <F2> when the cumulation set is selected or click and hold on the name to rename it.
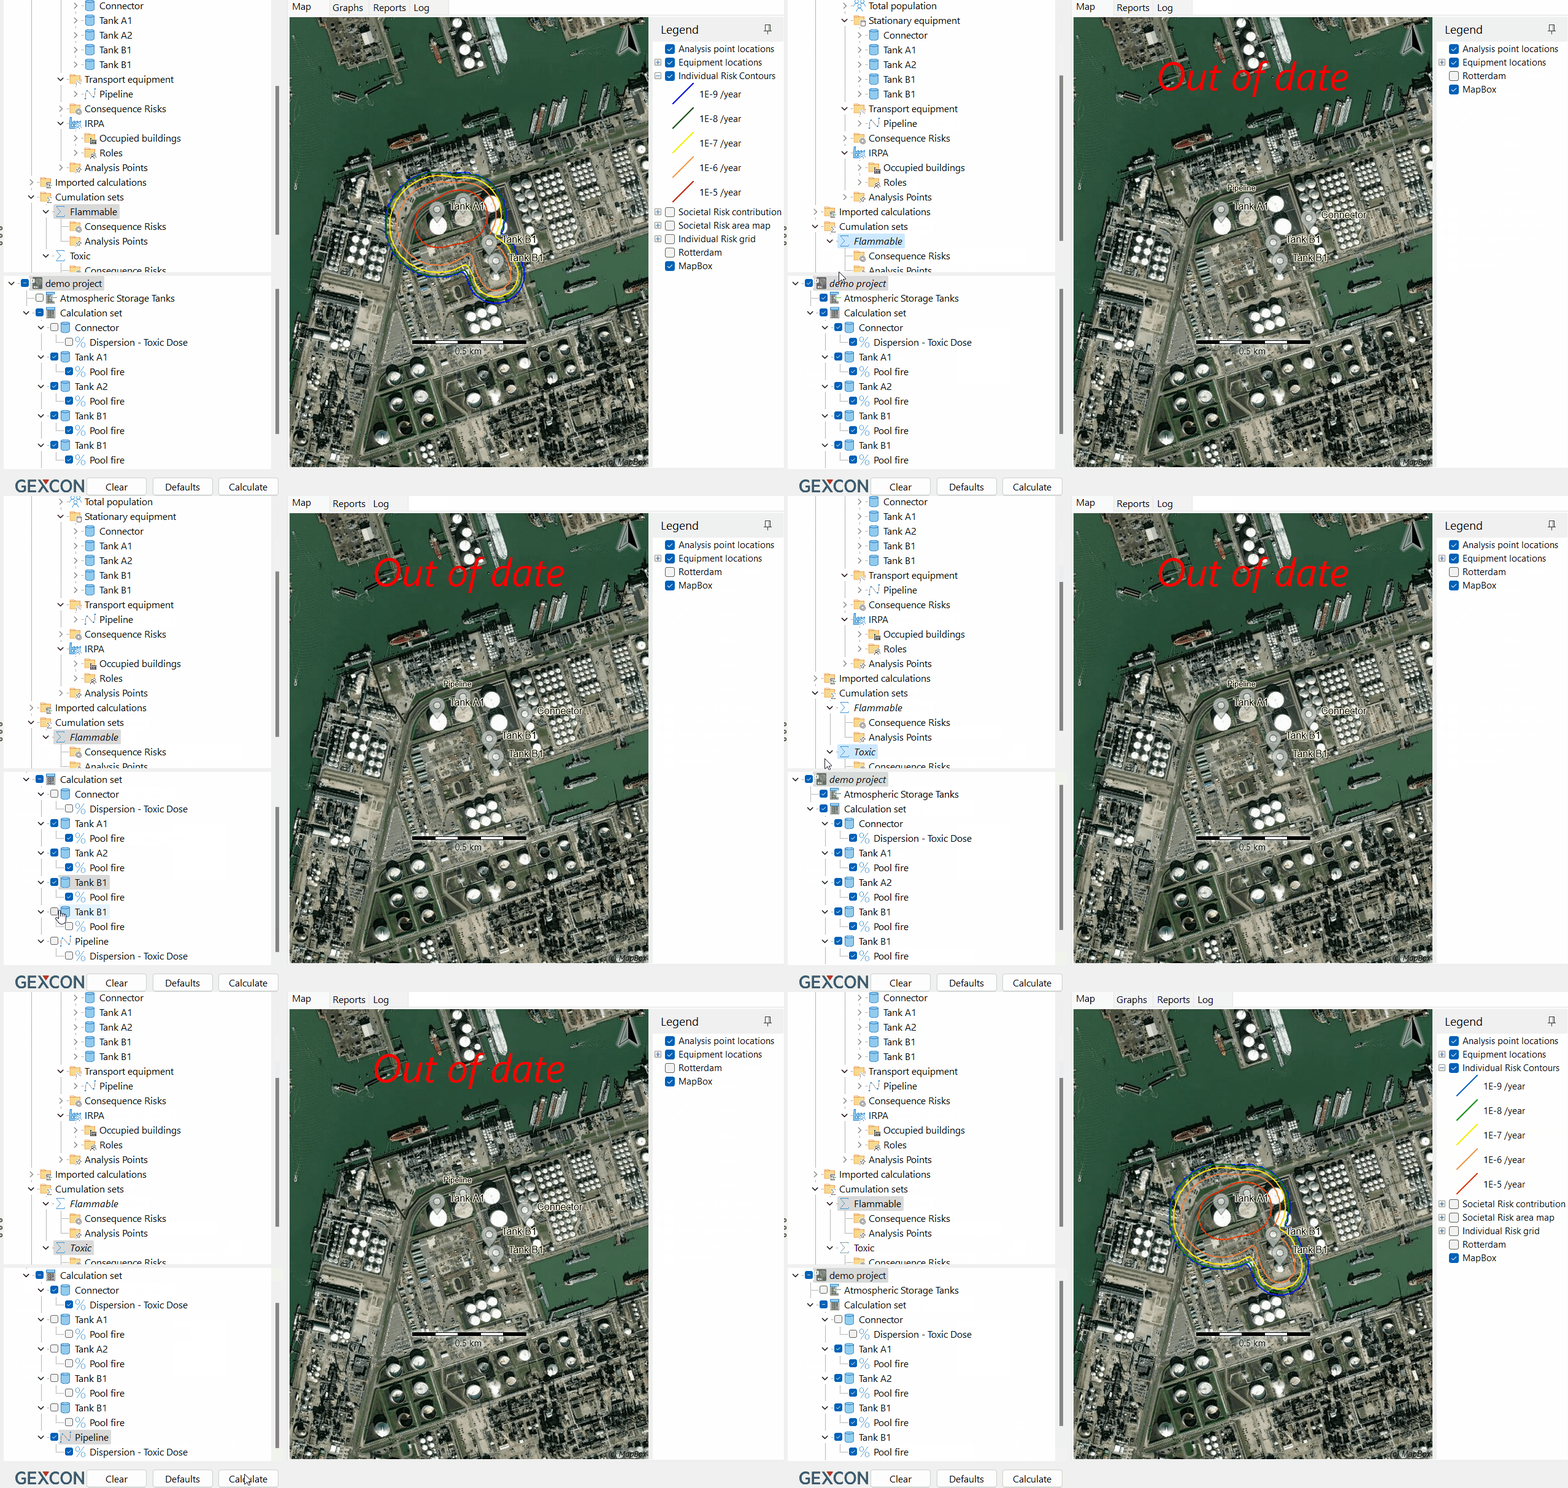
Select scenarios to be accumulated
Choose the scenarios, equipment or calculation sets to be accumulated from the tree in the input panel below the cumulation set.
Calculate
After pressing the <Calculate> button, the subset results will be presented.

Creating flammable and toxic scenario cumulation sets
Add Consequence Risks or Analysis Point (optional)
Similar to the calculation sets, you can add Consequence Risks and Analysis Points in the same way.
These nodes are available under each cumulation set node.
The results will only be influenced by the scenarios included in the cumulation set.
.png)
Position of Consequence Risk and Analysis Point in the cumulation set
Note
Societal risk maps CANNOT be combined from different "Calculation sets" or "Imported calculations"
Viewing results in different tabs
Map tab
In the Map tab, the contours resulting from a combination of all selected scenarios are displayed on top of the background map. For more information on working with graphs in the results section, refer to the Map tab article.
.png)
The selected scenarios in the panel (on the left) and the resulting Individual Risk iso-risk contours (on the right).
Graphs tab
The Graphs tab combines all selected scenarios into an fN curve. For detailed instructions on working with graphs in the results section, refer to the Graphs tab article.
.png)
The selected scenarios in the panel (on the left) and the resulting fN curve from accumulating risk of all selected scenarios (on the right)
Report
The report considers only the selected scenarios for that specific cumulation set and includes:
A list of scenarios with frequencies.
Maximum effect distances.
A societal risk ranking report.
.png)
The risk ranking report of a cumulation set with a few selected fire scenarios
Benefits of using cumulation sets
Improved analysis: Gain a holistic view of risks by consolidating different data sets into one cumulative outcome.
Comprehensive results: Achieve a single, combined result that reflects the entire site's or specific areas’ risk profiles.
Incorporates various risk indicators:
Individual Risk iso-risk contours
Societal Risk graphs
Societal Risk maps
Conclusion
Cumulation sets in RISKCURVES are a powerful tool that aggregate results from various risk sources, offering a thorough analysis of societal and individual risks. By combining different data sets into a single outcome, they provide a dynamic and comprehensive view of site-wide risks, incorporating Individual Risk iso-risk contours, Societal Risk fN graphs, and Societal Risk maps for enhanced decision-making. Additionally, they can work with Analysis Points and Consequence Risks for even more detailed and insightful risk assessments.

