- 05 Aug 2024
- 2 Minutes to read
Comparison sets
- Updated on 05 Aug 2024
- 2 Minutes to read
Comparison sets in RISKCURVES provide a streamlined method for comparing results from multiple calculations within a project. This feature allows users to efficiently evaluate and visualise differences between various scenarios, enhancing decision-making and risk assessment capabilities.
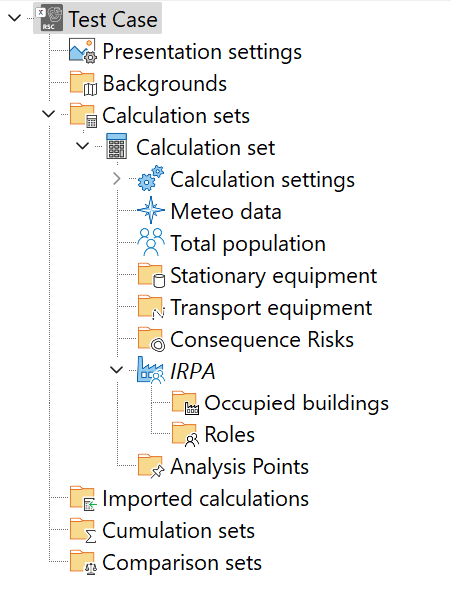
The comparison set is found at the bottom of the project tree, below the cumulation set node. The comparison set allows users to include or exclude specific scenarios, cumulation sets, or other comparison sets using a list of checkboxes.

Creating and using a comparison set
Add a comparison set
Right-click on the "Comparison set” node in the project tree
Select <Add comparison set> from the context menu.
Rename the comparison set
Select the newly created comparison set.
Press <F2> when the comparison set is selected or click and hold on the name to rename it.
Select scenarios to be compared
Choose the scenarios to be compared from the tree in the input panel below the comparison set.e
.gif)
Comparing results in different tabs
Map tab
In the Map tab, the contours of all selected results are displayed on the background map. This can result in numerous contour overlays, so it may be necessary to select specific contours or adjust their appearance for clarity. For more details on working with graphs in the results section, refer to the Map tab article.
.gif)
Note
Multiple grids are not included in the map comparison by default to prevent clutter. Users can enable the "Freeze layer" option from the map legend options to include an extra grid layer for comparison.
Graphs tab
The Graphs tab compares multiple fN curves from the selected scenarios. Users can select which curves to display using the legend above the graph. For detailed instructions on working with graphs in the results section, refer to the Graphs tab article.
.png)
Benefits of using comparison sets
Efficient analysis: Comparison sets enable users to quickly and easily compare multiple calculation scenarios, such as changes in population or production, within a single project.
Enhanced visualisation: Displaying risk contours and curves from various scenarios on a single map or graph helps users better understand the distinctions and similarities in risk between situations, facilitating a fast identification of areas of focus.
Conclusion
In conclusion, the comparison set in RISKCURVES offers a streamlined method for evaluating results from various project scenarios. Positioned at the end of the project tree, it allows users to include or exclude scenarios for comparison via checkboxes. By selecting scenarios or sets of scenarios and utilising different tabs like Map and Graphs, users can efficiently analyse and visualise risk contours and fN curves, enhancing decision-making capabilities. This feature significantly improves the efficiency and effectiveness of risk assessment projects.

