Using multiscenario to create sensitivity simulations for an explosion scenario
- 21 May 2025
- 1 Minute to read
Using multiscenario to create sensitivity simulations for an explosion scenario
- Updated on 21 May 2025
- 1 Minute to read
Article summary
Did you find this summary helpful?
Thank you for your feedback!
The multiscenario function can also be useful for conducting sensitivity simulations for various parameters. The following example presents an explosion scenario within an electrolyser container following an accidental and enclosed released of hydrogen.
Turbulence parameters play an important role in the initial phase of an explosion. Recommended default parameters for explosion scenarios are provided by Gexcon, however, in certain circumstances these may not be suitable. Performing sensitivities on turbulence and initial conditions can provide justification for their use and help quantify the overall influence on results.
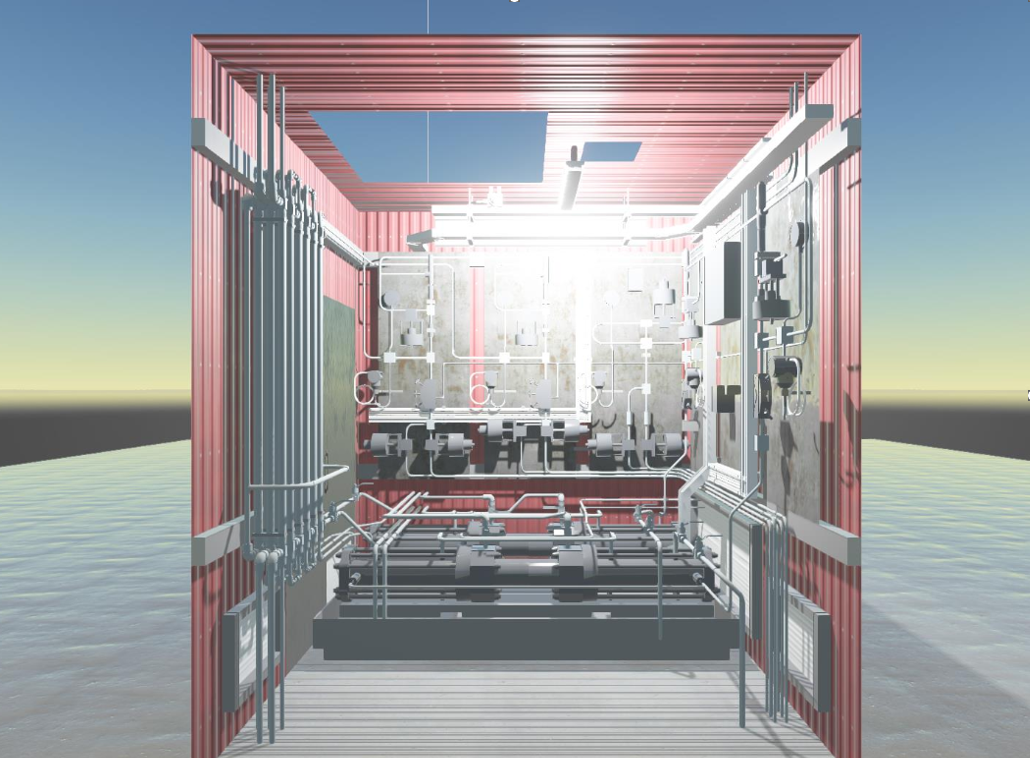
Electrolyser container geometry in FLACS
In this example, three sets of turbulence parameters will be modelled. The explosion scenario is based on the results of a dispersion modelling study where the results indicated the default turbulence parameters might be conservative.
Scenario overview
The sensitivity scenarios will be conducted on a base case explosion scenario considering ignition of a 2x2x2m cloud of stoichiometric hydrogen. The ignition location is set in the lower corner of the container.
Adding a generic node for varying turbulence parameters
Add a generic node: a generic node is added in Graph View
Change node to initial conditions: in node properties, the initial conditions turbulence relative turbulence intensity and characteristic velocity are added. The node is renamed to InCon1
Clone the initial conditions node: three clones of InCon1 are created and will be used as sensitivity tests.
Change the initial conditions properties: four sets of initial conditions are input into Node Properties as shown in the table below.
Node / conditions | Relative turbulence intensity | Characteristic velocity (m/s) |
|---|---|---|
InCon1 | 0.3 | 300 |
InCon2 | 0.25 | 250 |
InCon3 | 0.2 | 200 |
InCon4 | 0.1 | 100 |
Setup walk-through
Analysing results in Flowvis using multiscenario tables
Was this article helpful?