- 29 Oct 2024
- 5 Minutes to read
Simulating release from LNG bunkering
- Updated on 29 Oct 2024
- 5 Minutes to read
Onshore bunkering
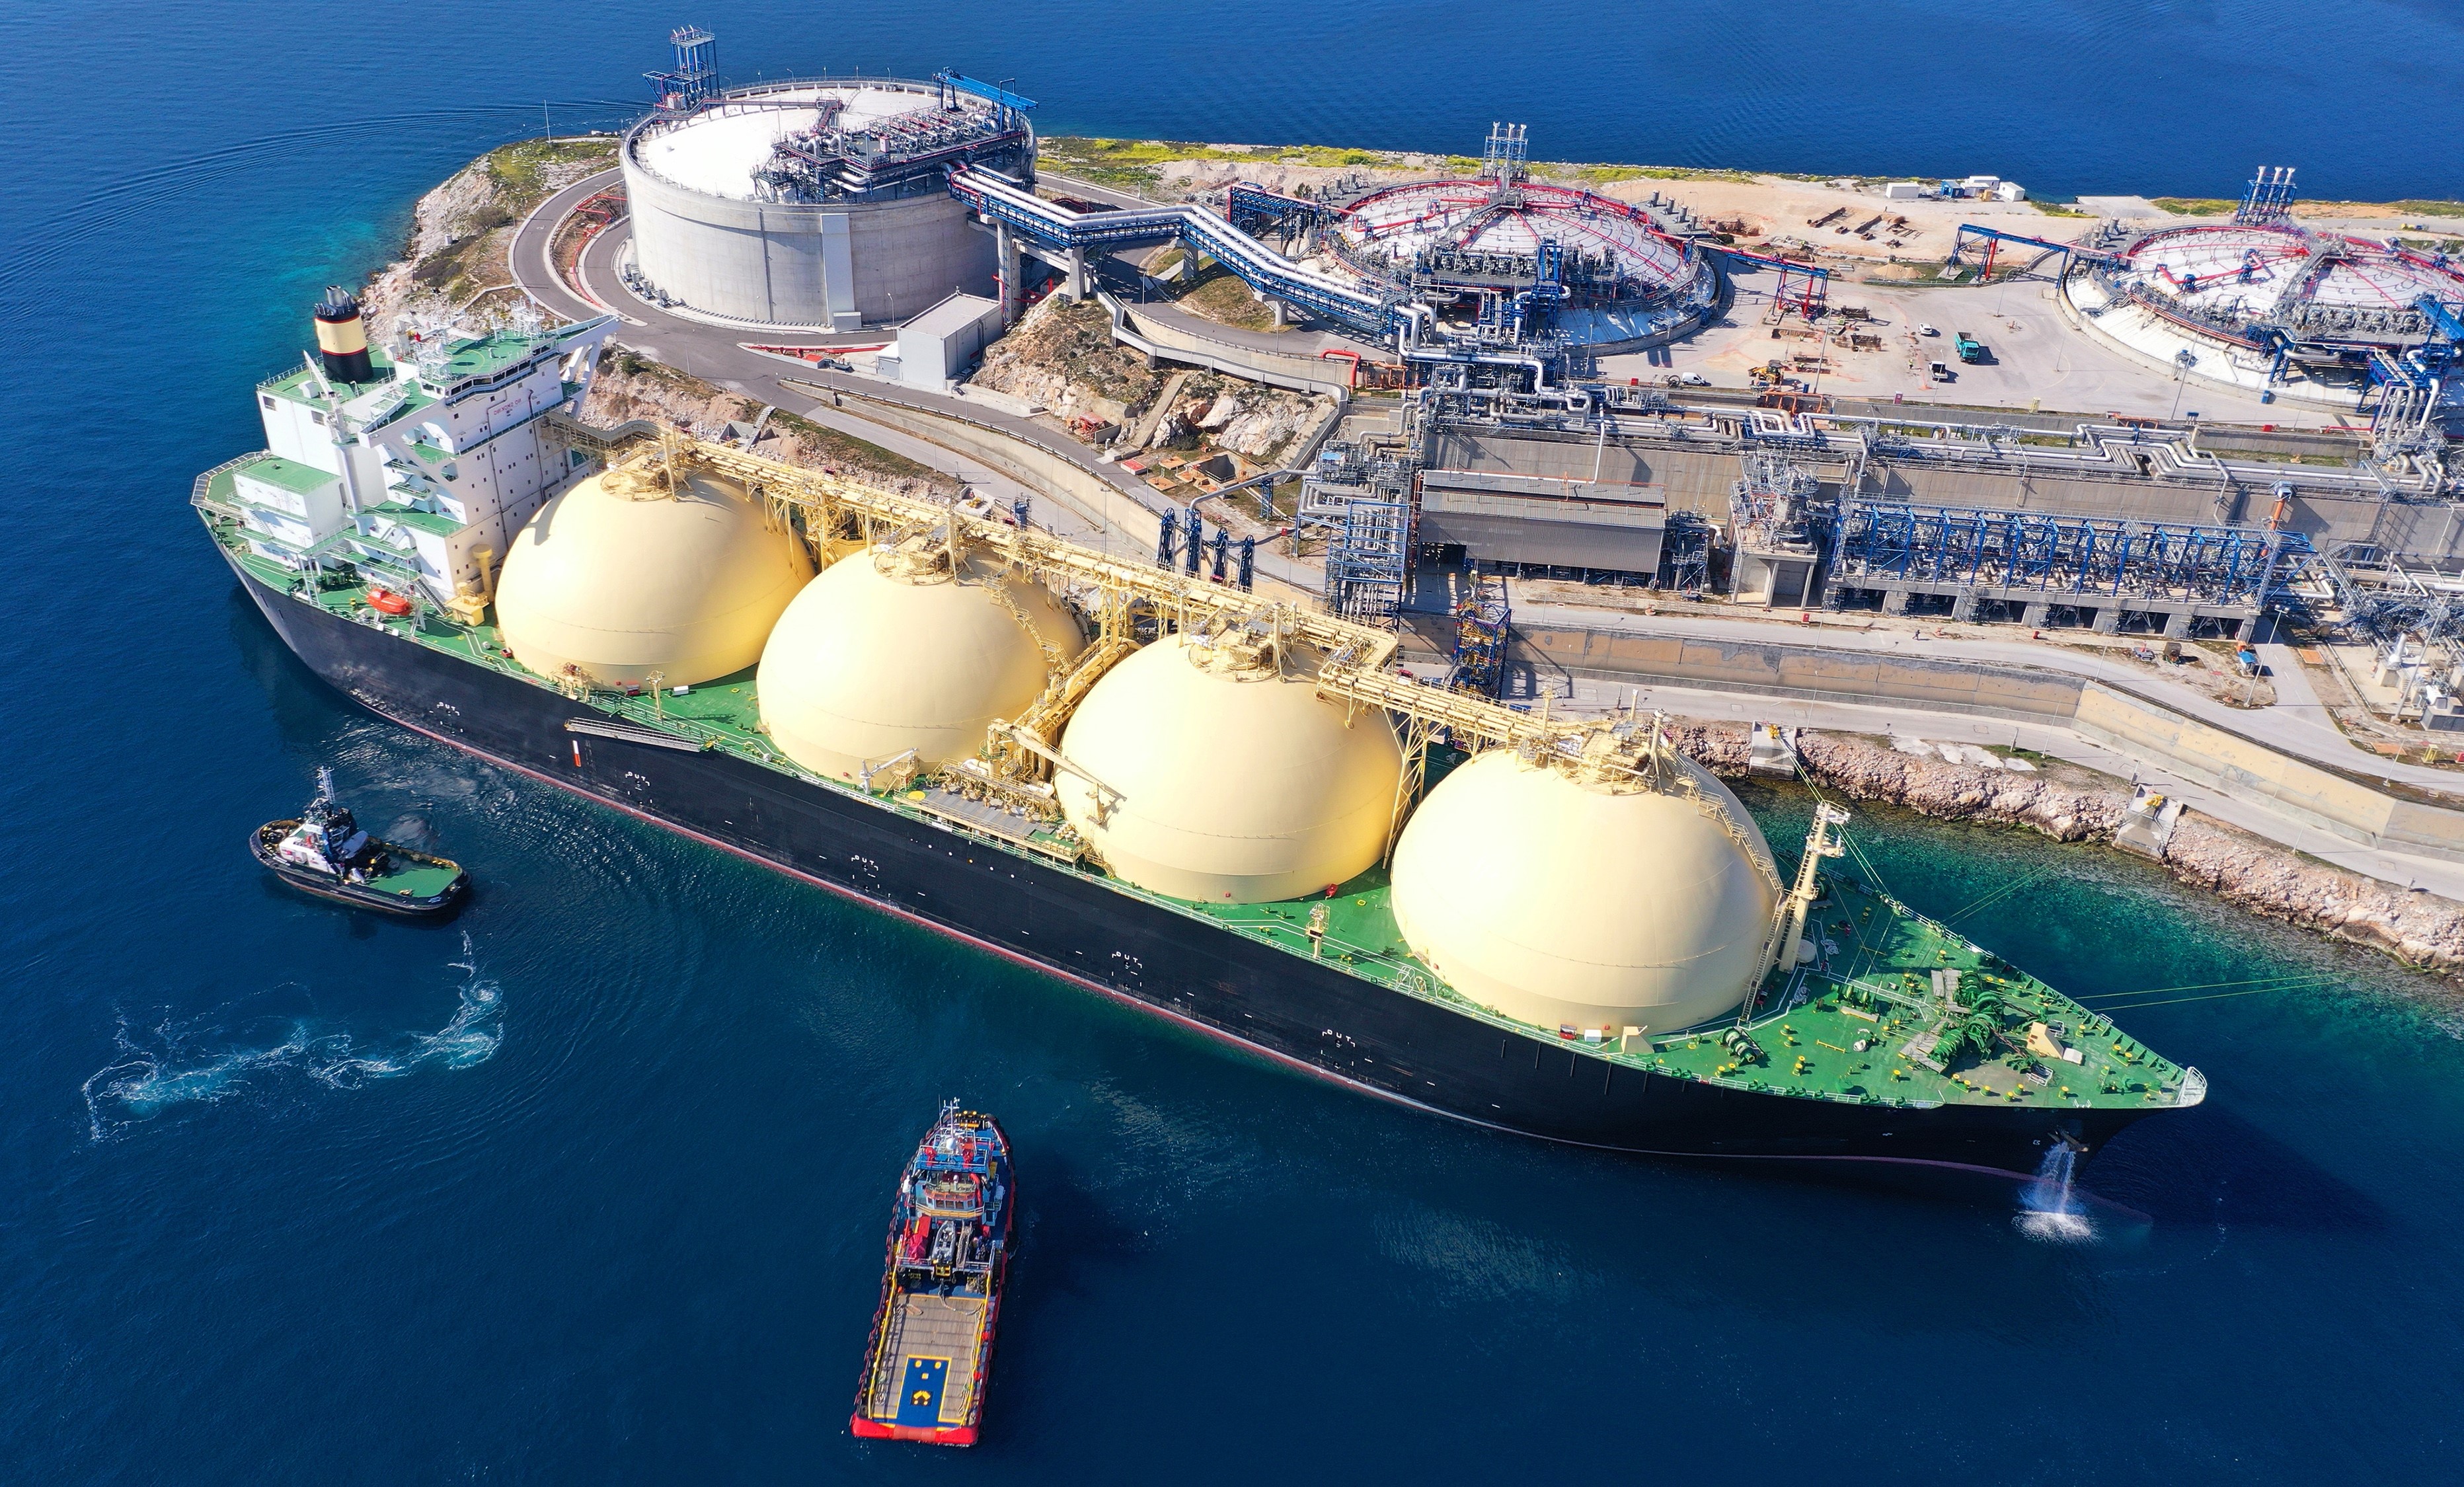
Onshore bunkering of LNG involves transferring LNG from land-based storage facilities to ships docked at a port, forming a crucial part of the LNG supply chain that enables efficient and safe refuelling of vessels. This process begins with LNG stored in specialised tanks at extremely low temperatures (-162°C) to maintain its liquid state. Bunkering stations within the port, equipped with necessary infrastructure like loading arms, transfer pumps, and safety systems, facilitate the transfer. Given the high energy content and cryogenic nature of LNG, strict safety protocols are followed.
Scenario
Corrosion on fuel delivery pipe |
|---|
Corrosion in a section of the fuel delivery pipes at the bunkering station goes undetected during routine inspections. The weakened pipe (150 mm in diameter) eventually ruptures under the pressure of fuel transfer, releasing a significant volume of fuel into the station.
|
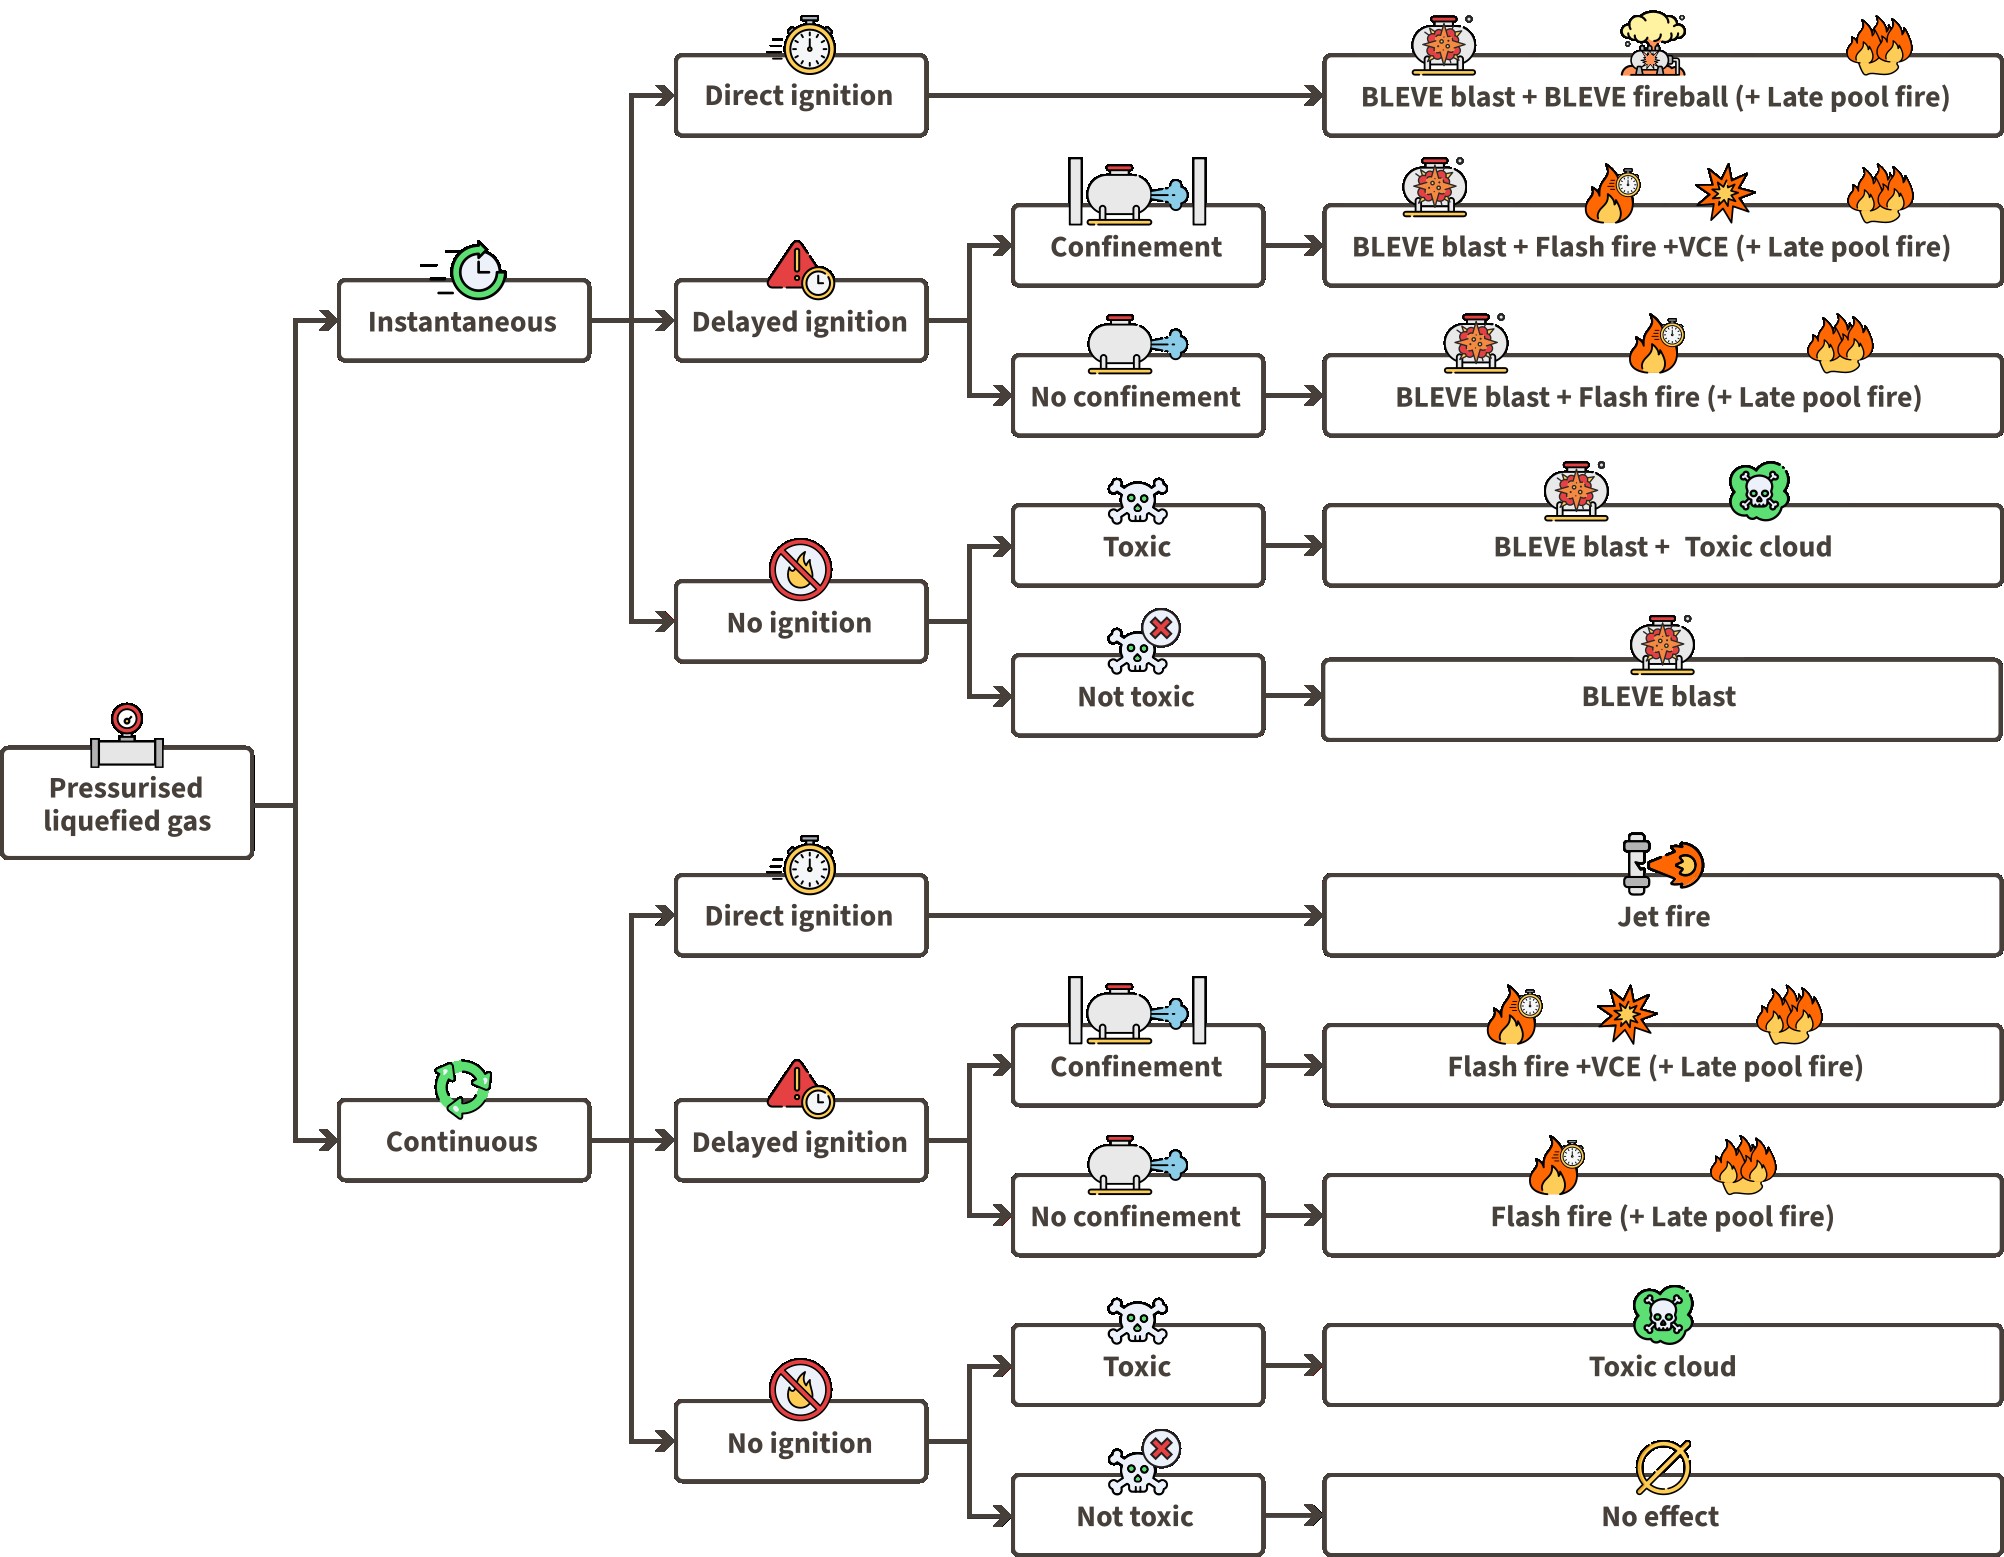
Using the liquefied gas event tree for continuous releases, we can assess the possible loss of containment scenarios:
Rapid vaporisation: The spilt fuel rapidly vaporises, forming a flammable cloud.
Delayed Ignition: If ignition is delayed, we need to assess the dispersion of the flammable cloud and its potential reach. The flammable cloud can be ignited by nearby equipment (e.g., a running generator), leading to a Flash Fire.
Congestion: A Vapour Cloud Explosion may potentially occur if the flammable cloud finds a congestion area (which the generator room could act as such). Such explosions may cause severe damage to the station's infrastructure and injuries to personnel. Ultimately, you want to assess if the surrounding population will be endangered.

Event tree for pressurised liquefied gases
Modelling approach
Source definition
To model a semi-continuous release of liquefied gases, we use the Liquefied Gas Release model or the Liquefied Gas LOC Scenario Continuous Leak.
The choice between individual models and a combined model will be addressed further in this article. Since the input parameters will be the same, we will explain the case by using individual models.
The Liquefied Gas Release model can be used to determine whether the material flashes and stays airborne or if it accumulates at the ground level and creates a pool.
One of the most important input parameters is the type of spray calculation. EFFECTS offers 3 types of spray models. The Statistical Spray methodology is the most advanced, considering the droplet breakup and calculating a randomised droplet size distribution. You can explore other input parameters in the project file included at the end of the article. As a result, the model determines that the LNG spill will create a pool.
See the results of the Liquefied Gas Release model below.
Representative vapour mass fraction (-) | 0 |
|---|---|
Adiabatic vapour flash fraction (-) | 0 |
Liquid mass fraction after flashing and rainout: (-) | 1 |
Nett mass flow to air (jet) (kg/s) | 96,743 |
Temperature jet/cloud (°C) | -161,5 |
Diameter of expanded jet (m) | 0,15 |
Nett mass flow rained out (kg/s) | 23,257 |
Temperature of the pool (°C) | -161,5 |
Density of the airborne mass (kg/m3) | 422,51 |
A pool evaporation model can be linked to the Liquefied Gas Release model to assess the vaporisation rate from the liquid spill. The Pool Evaporation model then determines the condition of the evaporated flammable cloud. This data can be used as the source of the subsequent dispersion.
Dispersion
Two semi-continuous sources (jetting airborne mass and evaporating pool) need to be considered for the dispersion model. Local legislation on consequence analysis may dictate the appropriate approach for combining these sources.
Note that combined models automatically merge mass sources from flashed material and evaporating pool, while individual models require manual linking of the dispersion and explosion models.
We can assume immediate ignition of evaporated and flashing material and add an explosion model. Alternatively, map the flammable cloud's travel and potential areas affected by delayed ignition using the Dispersion - Flammable Cloud model. This model can map the flammable mass within the LFL and UFL.
Explosion
To simulate the potential Flash Fire or VCE, the ‘‘Vapour Cloud Explosion’’ model in EFFECTS is used. This model estimates the overpressure effect of the event.
The table below shows the most important parameters of the VCE model. This model includes two calculation methods: the Multi-Energy method and the GAME overpressure method.
If '‘Use GAME overpressure method” = No is selected, then the model uses the Multi-Energy method.
The Multi-Energy method requires the definition of the “fraction cloud involved in explosion” and the “curve number”.
The “Total mass in flammable range” and the “Offset between release and explosion centre” are calculated using the dispersion model.
The vulnerability settings determine the translation of overpressure into damage effects.
Calculation Method | |
Use GAME overpressure method | No |
|---|---|
Fraction cloud involved in explosion (-) | 0,08 |
Curve number | 4 (Weak deflagration) |
Source Definition |
|
Total mass in flammable range (kg) | 6861,9 |
Offset between release and explosion centre (m) | 134,52 |
Meteo Definition |
|
Predefined wind direction | W |
Vulnerability |
|
Pressure lethality based on | Threshold pressure level |
Peak pressure total destruction (Indoors+Outdoors) (mbar) | 300 |
Lethality total destruction (Indoors+Outdoors) (-) | 1 |
Peak pressure indoors (glass) lethality (mbar) | 100 |
Lethality indoors (glass) (-) | 0,025 |
Results
The results typically include map contours, grids, graphs and comprehensive reports. This data help evaluate:
Spread and evaporation of the leaked LNG
Potential explosion impact and damage
Affected areas and extent of the impact
Pool evaporation
Graphical data in the report can evaluate the pool spread, showing that all incoming material immediately evaporates.
.png)
Radius and LNG pool evaporation vs time
Dispersion
Dynamic concentration grids show the cloud between LFL and UFL over distance and time, helping estimate the reach and accumulation of the flammable mass.
.gif)
Dynamic concentration grid
Explosion
Map visualisation shows an overpressure contour from the ignition of a flammable cloud. The results can be customised to meet specific analysis needs, such as adjusting contour levels and combining graphs. This customisation allows for a more tailored and informative analysis, depending on the particular aspects of the jet fire you need to emphasise.
For detailed guidance on how to adjust and interpret the presentation of results, explore the Results chapter. You are also able to export your contours to Google Earth. The relevant steps are detailed in the article How to export consequence results into Google Earth.
Conclusion
Effective simulation of LNG release scenarios is crucial for understanding potential hazards, mitigating risks, and ensuring safety during LNG bunkering operations. By modelling the release, dispersion, and potential explosions, we can better prepare for and manage incidents involving LNG.
Download the project file
Explore the project file simulating a leak during bunkering operations. Compare the results from the combined model and the individual model. Use the dynamic concentration grid to track the cloud between the Lower Flammable Limit (LFL) and Upper Flammable Limit (UFL) over distance and time. Evaluate the pool spread and its evaporation rate. Assess the potential explosion impact, and consider the potential offset for Vapour Cloud Explosion (VCE).
To view the project file, please open it using the EFFECTS software. If you don’t have the software, you can download and use the free viewing demo version of EFFECTS via the link below.
References
IMO. (2020) INTERIM GUIDELINES FOR THE SAFETY OF SHIPS USING METHYL/ETHYL ALCOHOL AS FUEL. Available at: https://wwwcdn.imo.org/localresources/en/MediaCentre/MeetingSummaries/Documents/MSC.1-Circ.1621%20-%20Interim%20Guidelines%20For%20The%20Safety%20Of%20ShipsUsing%20MethylEthyl%20Alcohol%20As%20Fuel%20%28Secretariat%29%20%282%29.pdf


