- 23 Oct 2024
- 3 Minutes to read
Simulating hydrogen gas fireball
- Updated on 23 Oct 2024
- 3 Minutes to read
What is a Gas Fireball?
A hydrogen Gas Fireball occurs when a highly pressurised flammable gas is instantaneously released and immediately ignited. Initially, the fireball forms a hemispheric shape. Loss of integrity leading to a fireball can be caused by overheating, mechanical damage or internal explosion.
.png)
Gas fireball
Scenario
Internal explosion |
|---|
This scenario involves an internal explosion of a 40 m3 pressurised hydrogen storage tank at 10 bar due to induced oxygen via a malfunctioning membrane from the electrolysis process. .png) (Zum News, 2019) |
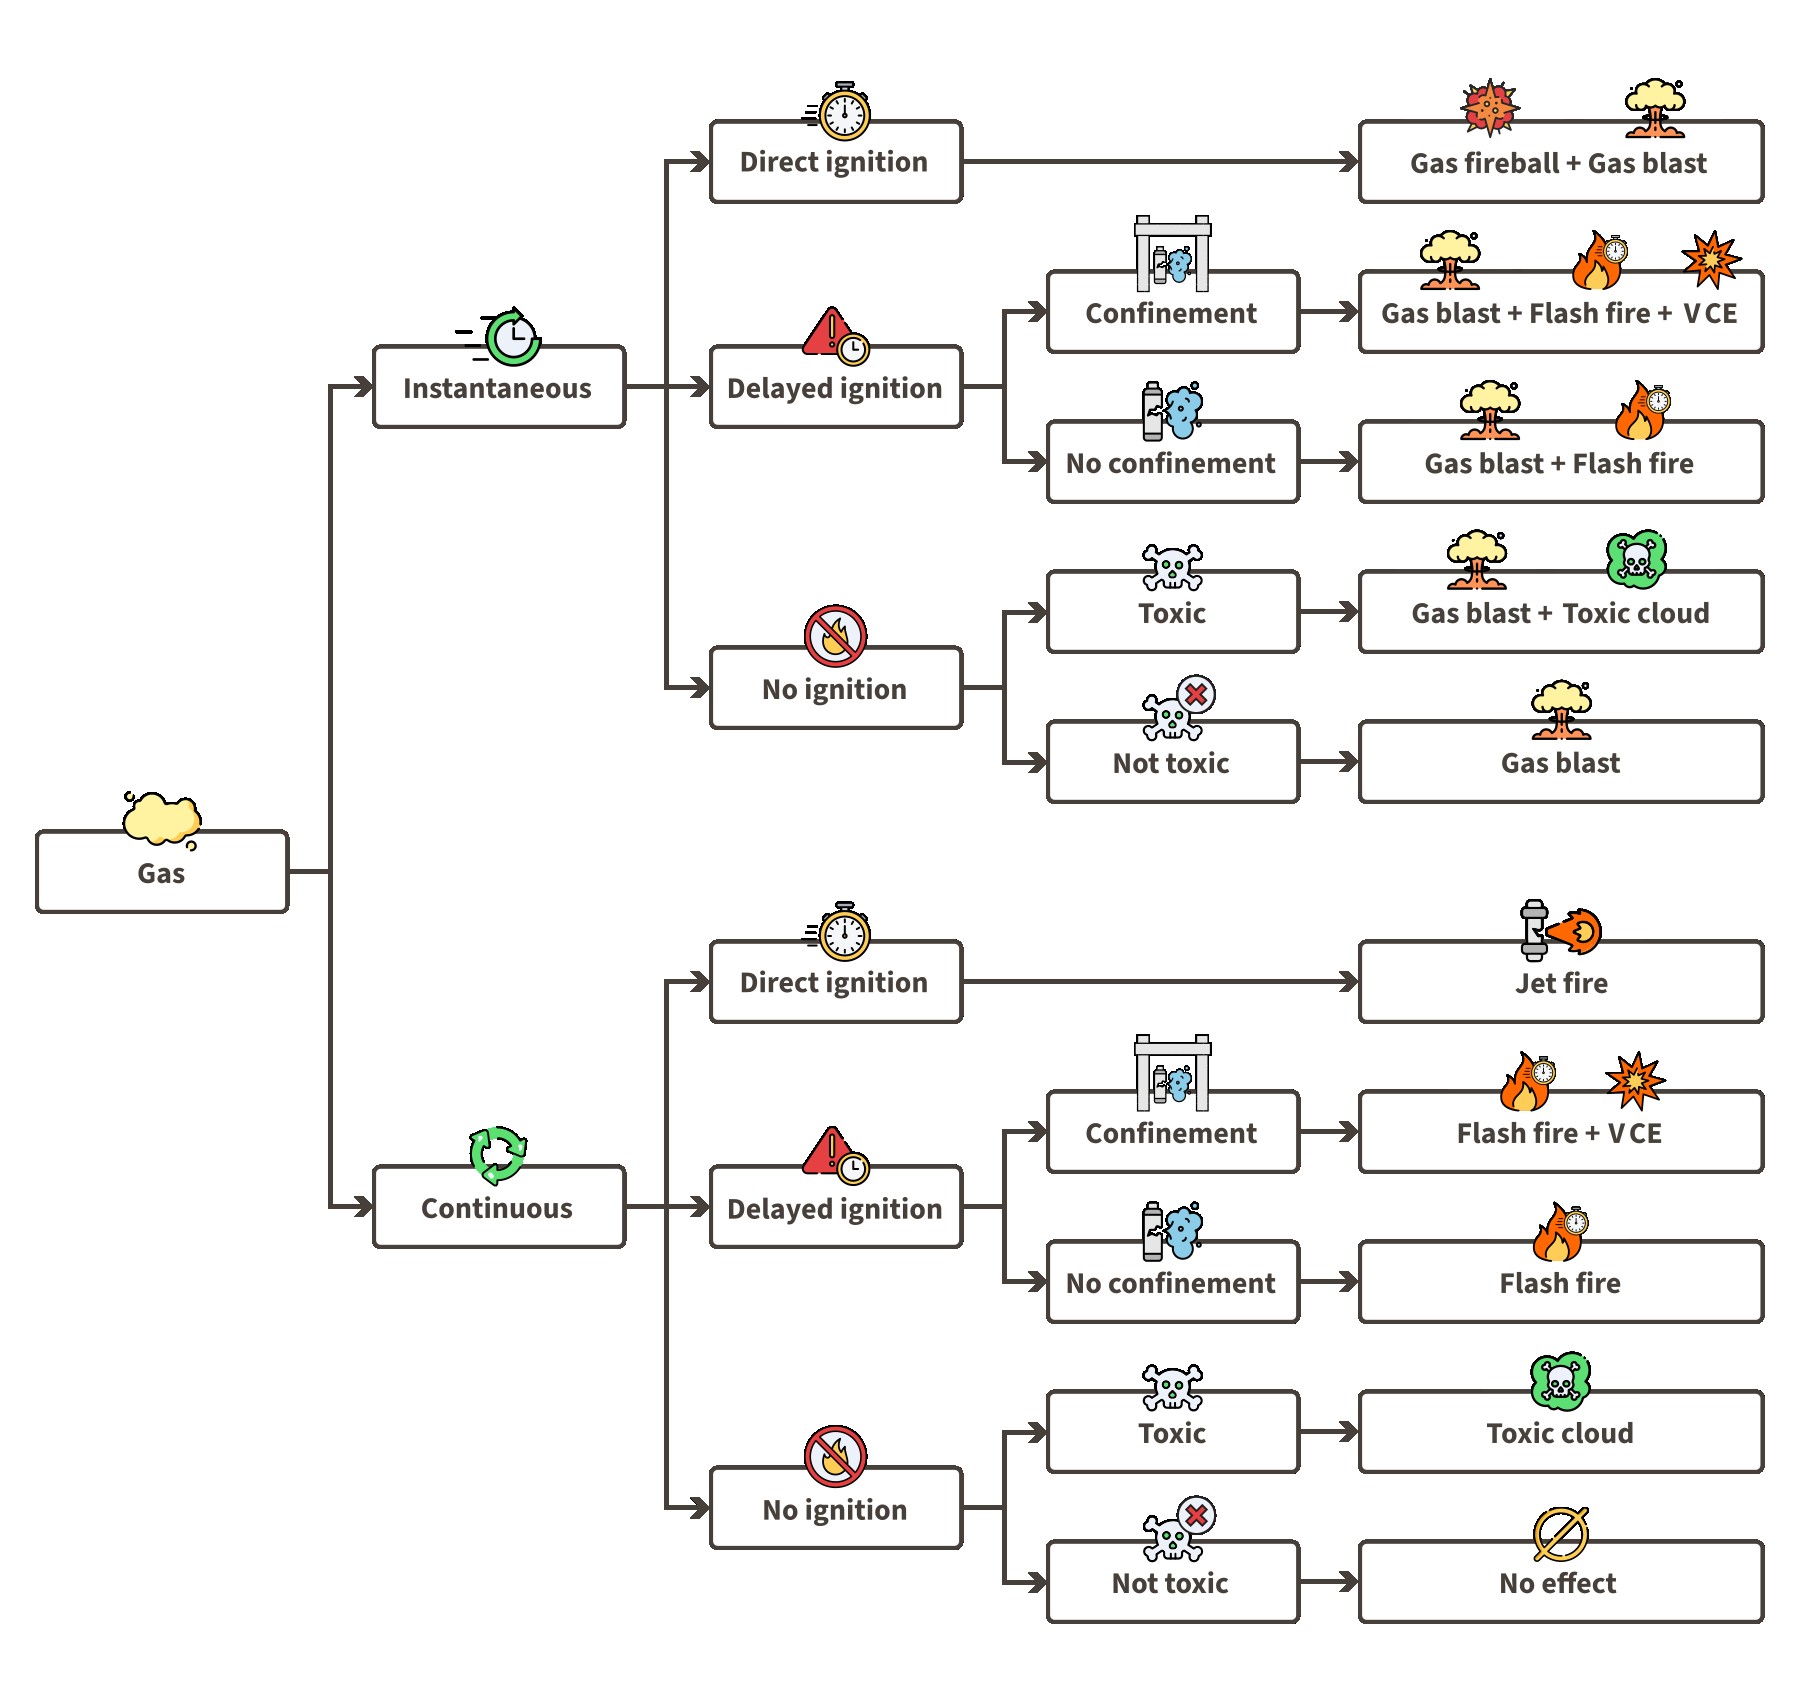
Using the gas event tree for instantaneous releases, we can assess the possible loss of containment scenarios:
Direct ignition: The instantaneously released hydrogen will likely ignite due to its low ignition energy, either from friction or because ignition may already occur inside the tank due to the explosive atmosphere.
Gas fireball: Upon ignition a Gas fireball will be formed.
Gas blast: The fireball will be accompanied by a blast effect as a result of gas expansion and high laminar burning velocity.

Gas Loss of Containment event tree
Modelling approach
To simulate this scenario, you can follow the following steps:
Add background. Define the context and environment for the simulation.
Add receivers (optional). Identify vulnerable areas or congested regions where flammable cloud dispersion might occur.
Add equipment. Set the location of the hydrogen storage tank on the map.
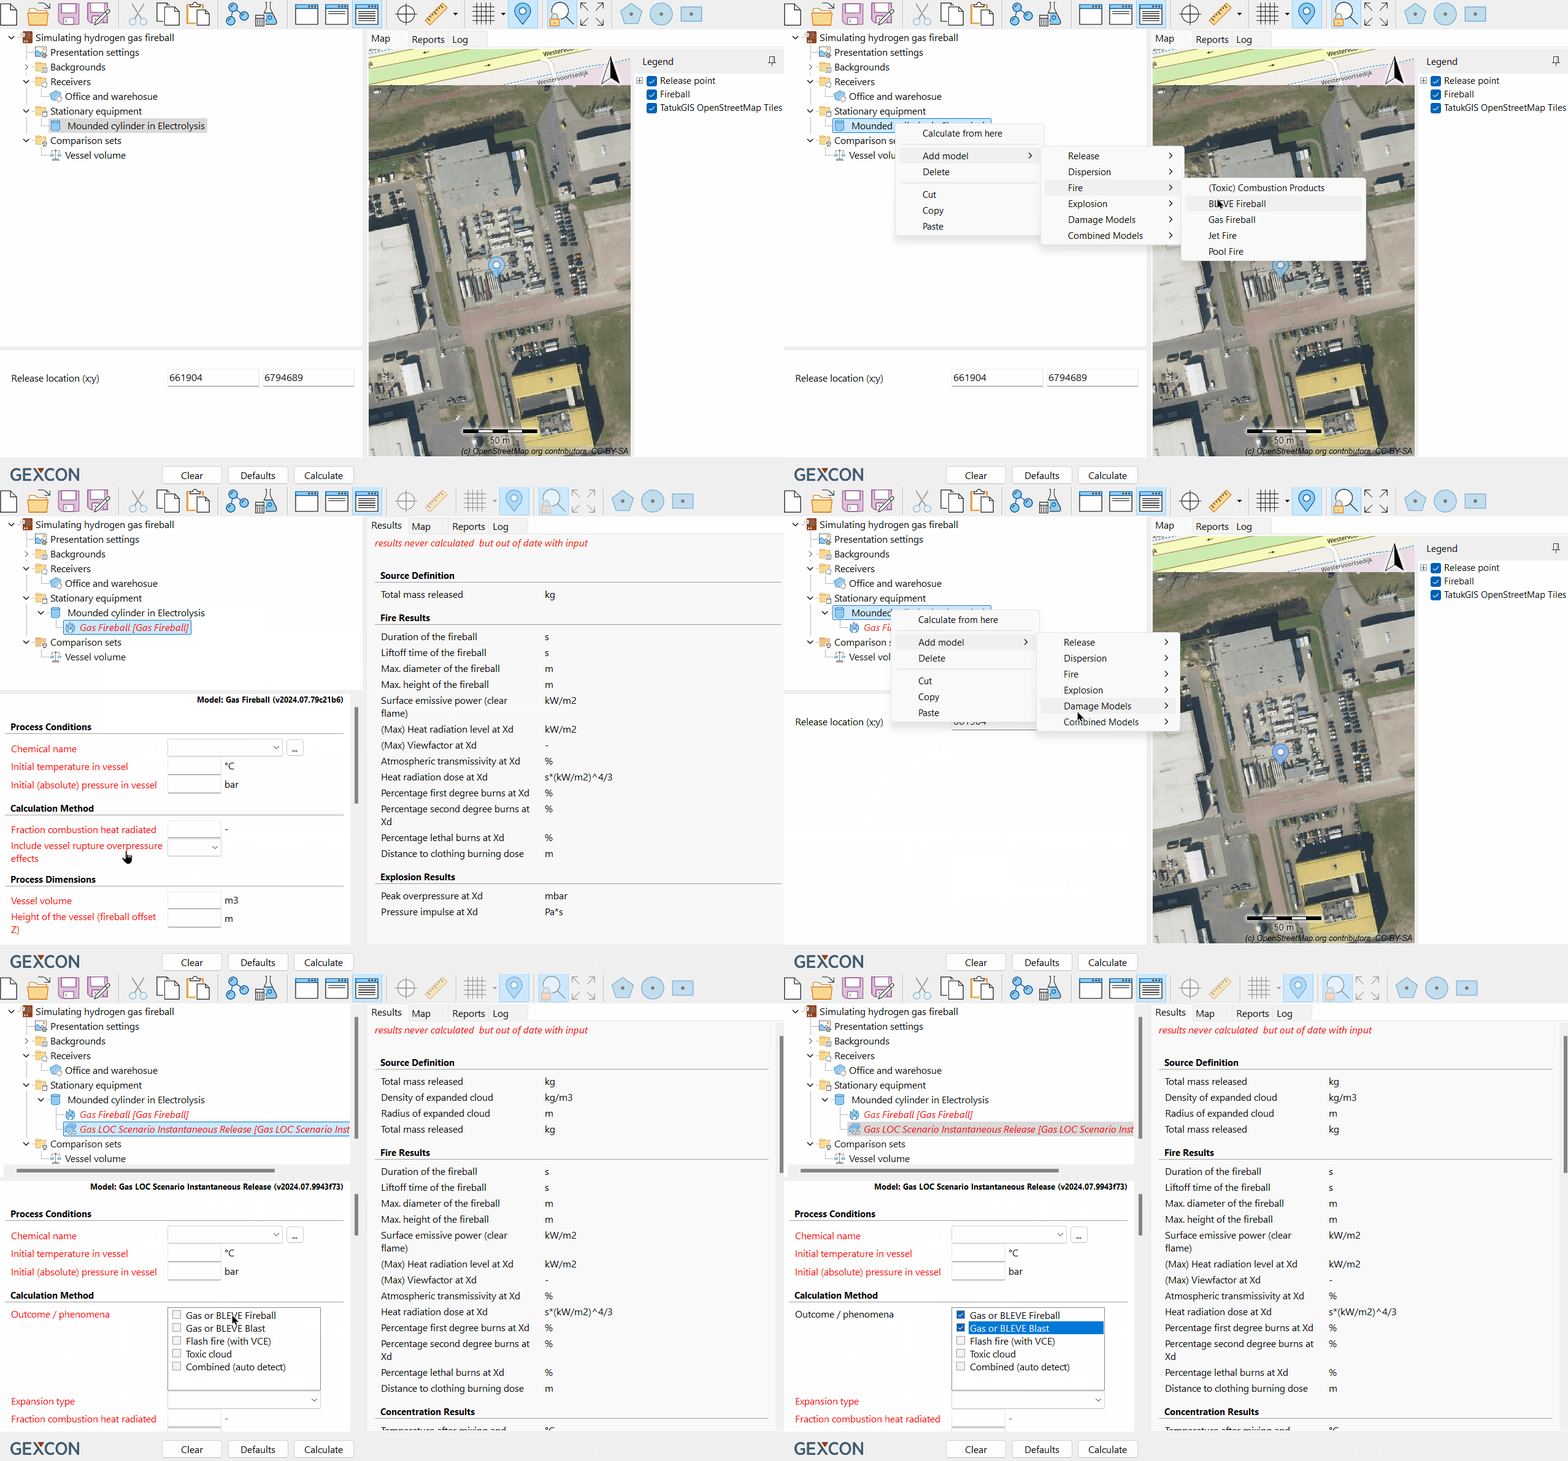
Select models. Start from the point of release and add subsequent models in the order of events to create a model tree.
Model selection
The hydrogen Gas Fireball can be modelled using the Gas Fireball model, either individually or as part of a combined model (see video below). Both the Gas Fireball and Gas LOC Scenario Instantaneous Release models are suitable for this scenario.

Adding hydrogen fireball scenario using model ''Gas Fireball'' and combined model ''Gas LOC Scenario Instantaneous''
Inputs
The most important required inputs are as follows, which will be used to calculate the heat radiation from the fireball as well as its destructive nature:
Initial pressure and temperature.
Exposure duration
Heat radiation Probit values. These settings are set to Dutch standards by default but can be customised in EFFECTS options.
The model calculates the heat radiation from the fireball, being the predominant effect. Additionaly, the model offers optional overpressure effect calculation (see table below) which will add the Gas Blast method.
The Gas Fireball model requires the following inputs:
Process Conditions |
|
Chemical name | HYDROGEN (DIPPR) |
|---|---|
Initial temperature in vessel (°C) | 9 |
Initial (absolute) pressure in vessel (bar) | 10 |
Calculation Method |
|
Include vessel rupture overpressure effects | Yes |
Process Dimensions |
|
Vessel volume (m3) | 40 |
Height of the vessel (fireball offset Z) (m) | 1 |
Environment |
|
Ambient temperature (°C) | 9 |
Ambient relative humidity (%) | 83 |
Ambient pressure (bar) | 1.0151 |
Vulnerability |
|
Maximum heat exposure duration (s) | 20 |
Take the protective effects of clothing into account | No |
Heat radiation lethal damage Probit A ((sec*(W/m2)^n)) | -36.38 |
Heat radiation lethal damage Probit B | 2.56 |
Heat radiation damage Probit N | 1.3333 |
Results
Heat radiation levels selected for presentation:
35 kW/m2: Lethal
12.5 kW/m2: Ignites wood, melts plastics
4 kW/m2 : Significant burn risk
Overpressure levels selected for presentation:
300 mbar: Total destruction
137.9 mbar: Moderate damage to buildings, injuries from flying glass and debris
68.948 mbar: Window glass shatters
The map visualisation displays the fireball area (where 100% lethality is assumed), heat radiation contours, heat radiation grids, and lethality contours. This data help evaluate:
The size of the area affected by the fireball.
Expected heat radiation levels at various distances from the explosion.
Damage (burns) or lethality expected at different distances from the source.
.png)
Radiation and overpressure contours
Results can be customised to meet specific requirements by adjusting parameters such as contour levels, contour and grid colours, combining graphs for tailored analysis, etc. For detailed guidance on adjusting and interpreting results, refer to the presentation of results chapter. Additionally, you can export your contours to Google Earth. Detailed steps are available in the article, How to export consequence results into Google Earth.
.png)
Fireball contours in Google Earth
Download the project file
Explore the project file simulating the hydrogen fireball. Adjust map contours, select different graphs or multiple graphs at once, and evaluate how different hole sizes influence the received heat radiation dose. Inspect the receiver’s reports to assess the damage effect.
To view the project file, please open it using the EFFECTS software. If you do not have the software, you can download and use the free viewing demo version of EFFECTS via the link below.
References
Zum News (2019) Fire at a factory near the hydrogen tank explosion site… “Investigating the connection”. Available at: https://news.zum.com/articles/52691723

