- 06 Nov 2024
- 7 Minutes to read
Pressurised liquefied ammonia release from railroad tanker
- Updated on 06 Nov 2024
- 7 Minutes to read
Ammonia dispersion
Ammonia is widely used in the chemical industry, especially as a refrigerant in mechanical compression systems at a large number of industrial facilities. Other uses of ammonia are as a fertilizer, as a precursor to nitrogenous compounds, as a cleaner, for the fermentation industry, etc. Ammonia is a toxic gas under ambient conditions. However, many parts of a refrigeration system contain ammonia liquefied under pressure or refrigerated below its normal boiling temperature. Releases of ammonia can have potentially harmful effects on workers and the public. If ammonia is under pressure, the risk of exposure increases since larger quantities of the refrigerant have the potential for rapid release into the air. That is the reason why the consequence simulation of ammonia releases is so important. This way safety professionals can assess beforehand the potential hazards of an accidental release so that appropriate mitigation and prevention measures can be implemented.
Scenarios
Road tanker - Pressurised ammonia | |
|---|---|
The scenario consists of the accidental release of ammonia from a railroad tanker transporting liquefied ammonia at its vapour pressure.
| |
01 Bottom discharge | 02 Discharge above the liquid phase |
In the first simulation approach, it is assumed that the hole through which the release occurs is located at the bottom of the road tanker, therefore, the release presents a two-phase outflow consisting of the saturated liquid and flashed vapour fraction.
| The second simulation approach assumes that the hole is right above the liquid level inside the road tanker, thus the release consists of vapour potentially with liquid droplets.
|
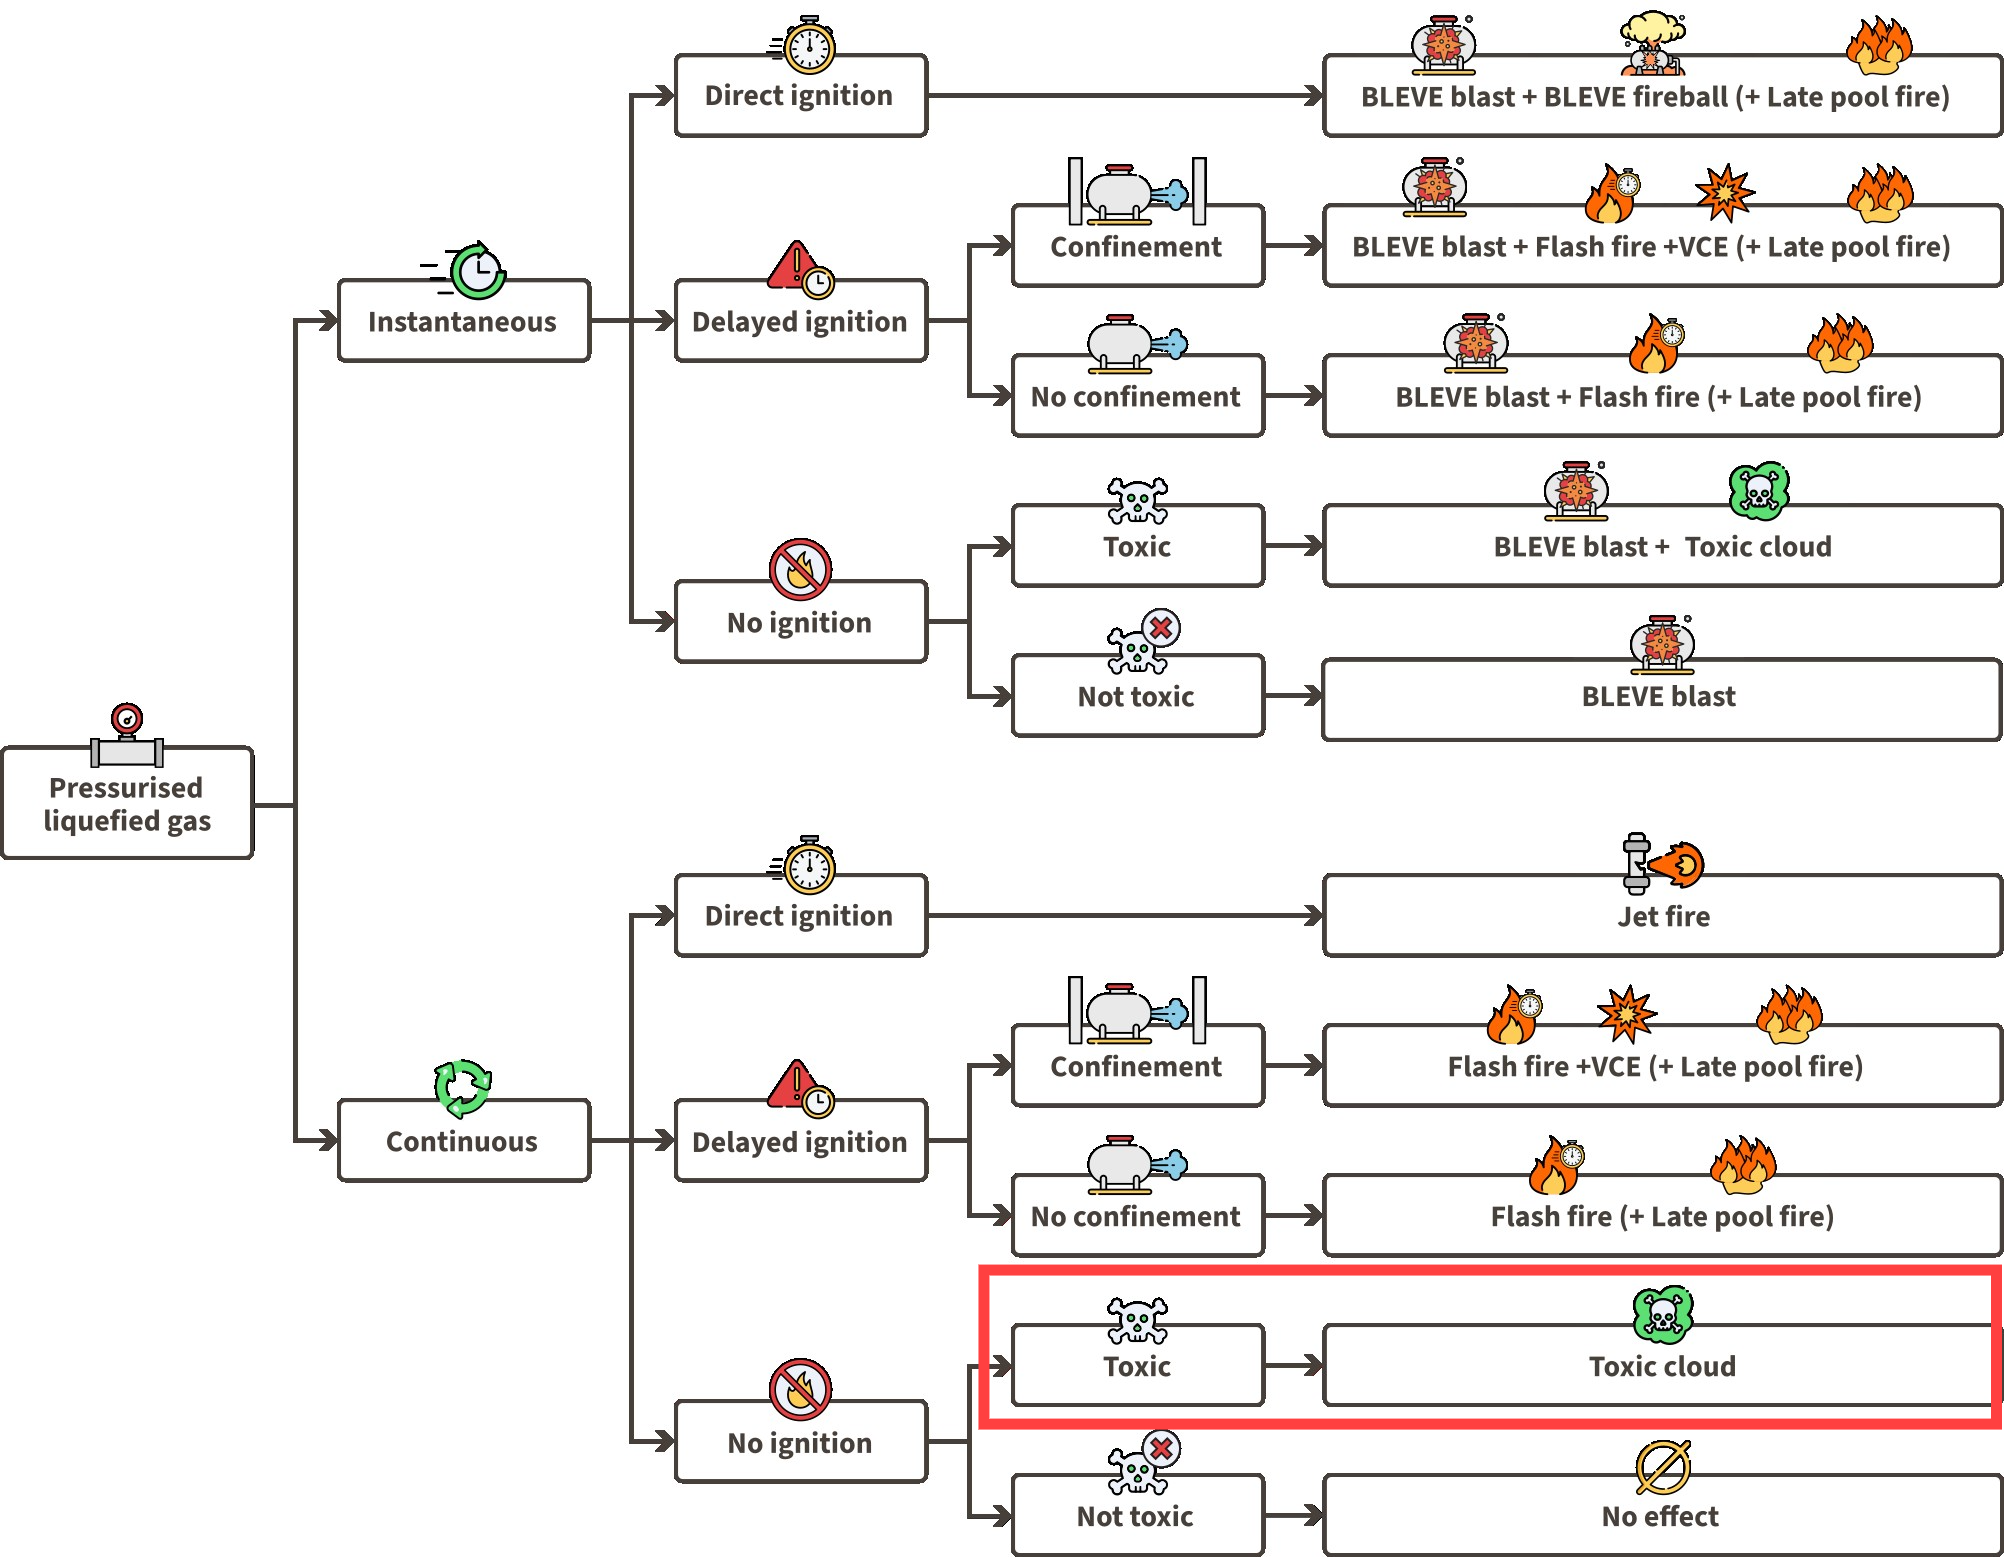
01 Bottom discharge: Using the liquefied gas event tree for continuous releases, we can assess the possible events for the loss of containment scenario 01 by looking at the continuous release half of the event tree. Since ammonia’s flammability is usually neglected due to its toxicity, we will only analyse scenarios with ‘‘No ignition’’:
Pool creation: Liquefied ammonia may possibly create a pool. This depends on storage conditions.
Toxic cloud: The ammonia leak rapidly vaporizes (flashes), forming a two-phase toxic cloud. The ammonia cloud containing liquid droplets will disperse over large distances.

Liquefied gas LOC event tree
Ammonia properties
Ammonia’s flammability limits are 15-28%, making it potentially flammable at those concentrations in air. However, this range is very limited, and before ammonia reaches such concentrations, its high toxicity would have already caused fatalities among those exposed. Therefore, flammability is not a primary concern, as toxic exposure would result in deaths first.
02 Discharge above the liquid phase
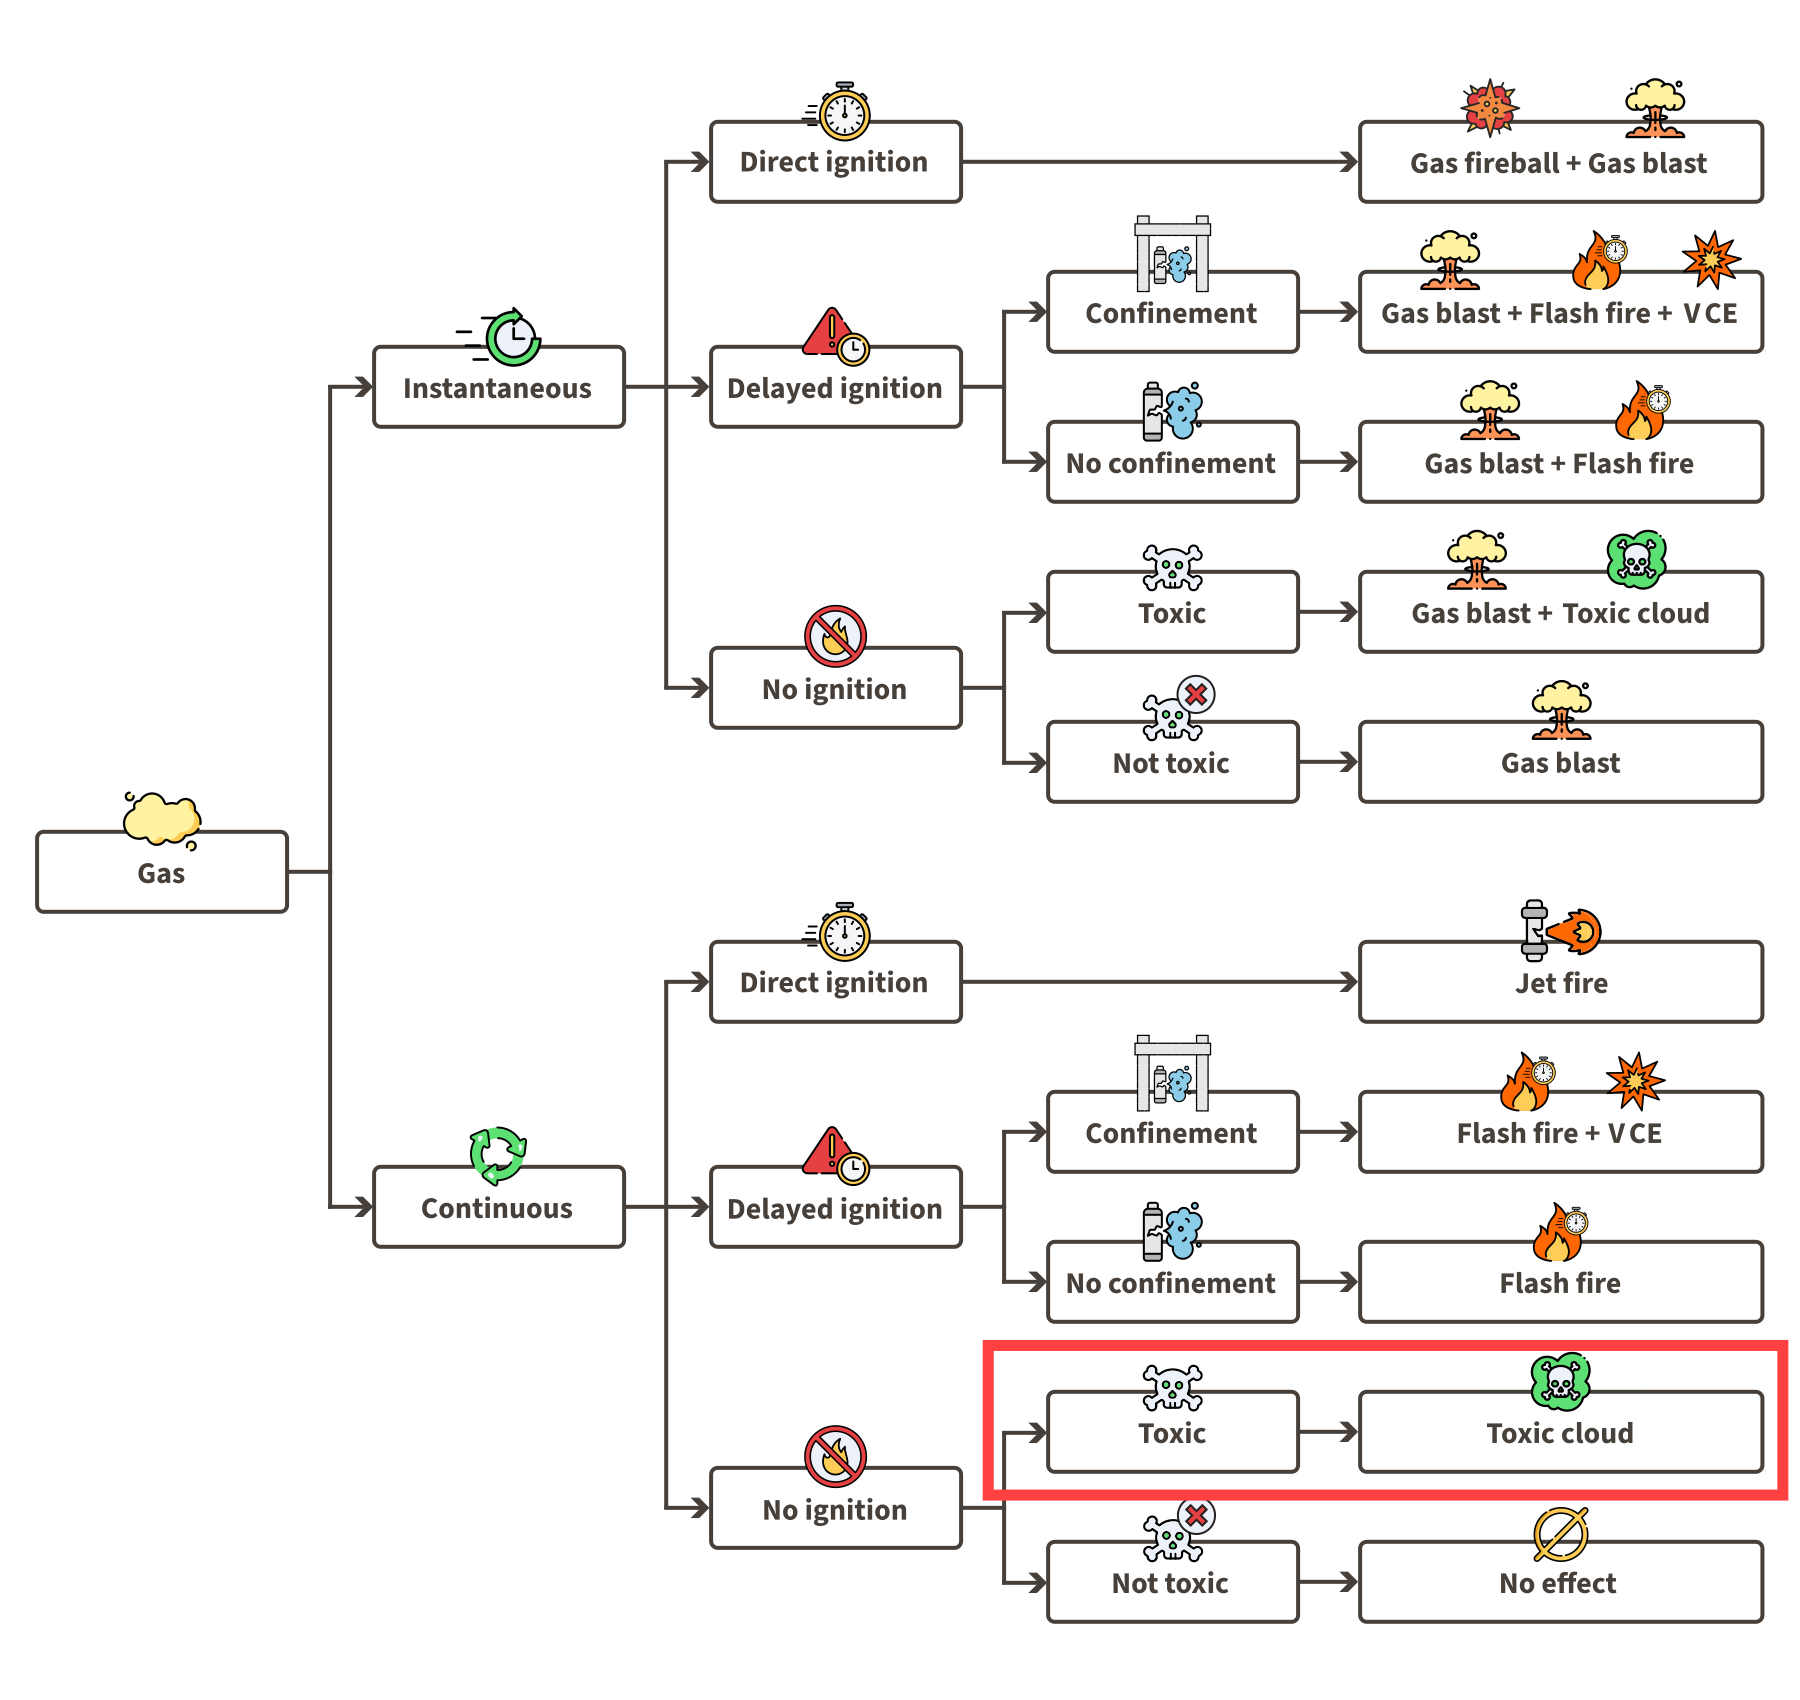
Using the gas event tree for continuous releases, we can assess the possible events for the loss of containment scenario 02 by looking at the continuous release half of the event tree. Since the ammonia is hardly flammable we will only analyse scenarios with ‘‘No ignition’’:
Toxic cloud: The rapidly released ammonia vapour may carry liquid droplets and disperse over large distances.

Gas LOC event tree
Modelling approach
To simulate this scenario, you can follow the following steps:
Add background. Define the context and environment for the simulation.
Add receivers (optional). Identify vulnerable areas where toxic cloud dispersion might occur.
Add equipment. Set the location of the ammonia release takes place on the map.
Select models. Start from the point of release and add subsequent models in the order of events to create a model tree.
Model selection
The toxic cloud dispersion can be modelled using the ‘‘Dispersion - Toxic dose’’ model. To determine the source condition for this model, the exit conditions of the pressurised liquefied ammonia continuously leaking from the vessel, the release model ‘‘Liquefied Gas Release’’ may be applied. Alternatively, the whole chain of events can be simulated using the combined model ‘‘Liquefied Gas LOC Scenario Continous Leak’’.
Inputs
Source conditions
The modelling of ammonia release events starts with the release event definition:
The spray model within the liquefied gas release model determines the airborne mass and mass which rains out.
The selected type of outflow is ‘‘Release through a hole in the vessel’’ because the ammonia is released continuously from the vessel.
The ‘‘Height leak above the tank bottom’’ is set to 0 m for bottom discharge and 2 m for discharge above the liquid level.
For ‘‘type of vapour release calculation’’, the advanced "DIERS" model is selected for top venting situations which accounts for the champagne effect carrying liquid droplets.
The table below shows the most important model inputs and differences in the definition of two different initial conditions, release below and above the liquid level.
The Liquefied Gas Release model requires the following inputs:
Process Conditions | Outflow below liquid level | Outflow above liquid level |
Chemical name | AMMONIA (DIPPR) | AMMONIA (DIPPR) |
|---|---|---|
Initial temperature in vessel (°C) | 20 | 20 |
Pressure inside vessel determination | Use vapour pressure | Use vapour pressure |
Calculation Method | ||
Use which representative rate | Second 20% average (toxic) | Second 20% average (toxic) |
Type of vessel outflow | Release through hole in vessel | Release through hole in vessel |
Type of release duration | Calculate until device is empty | Calculate until device is empty |
Type of spray calculation | Spray release model (Yellow Book) | Spray release model (Yellow Book) |
Expansion type | Adiabatic | Adiabatic |
Type of vapour release calculation | N/A | Diers top venting |
Type of flow inside the vessel | N/A | Bubbly flow |
Process Dimensions | ||
Vessel volume (m3) | 20 | 20 |
Filling degree (%) | 80 | 80 |
Vessel type | Horizontal cylinder | Horizontal cylinder |
Length cylinder (m) | 5 | 5 |
Hole diameter (mm) | 125 | 125 |
Hole rounding | Sharp edges | Sharp edges |
Height leak above tank bottom (m) | 0 | 2 |
Height leak above ground level (m) | 2 | 2 |
The results of the release model in the table below show that no content rains out. All released mass remains airborne, allowing its further spread to be modelled using the Dispersion model.
Results | Outflow below liquid level | Outflow above liquid level |
Time needed to empty vessel (s) | 55 | 609 |
|---|---|---|
Nett mass flow to air (jet) (kg/s) | 227,66 | 22,251 |
Temperature jet/cloud (°C) | -33,43 | -33,43 |
Nett mass flow rained out (kg/s) | 0 | 0 |
Density of the airborn mass (kg/m3) | 4,0078 | 3,105 |
Unsure what this parameter means?
Read more on the input parameters in the help file directly in EFFECTS. Right-click at the parameter’s name in EFFECTS input panel and select <Help>, to open the help file.
Representative vapour mass fraction:The vapour mass fraction at the exit conditions for the selected "representative" situation.
Adiabatic vapour flash fraction: The amount of mass that CAN evaporate when cooling down to boiling temperature in atmospheric conditions.
Liquid mass fraction after flashing and rainout: The amount of mass in the cloud which is still in liquid condition, e.g. dragged along with the flashing vapour as droplets.
Nett mass flow to air (jet): The amount of material that remain airborne.
Nett mass flow rained out: The amount of liquid that ends up in a liquid pool.
Dispersion modeling
Linking the dispersion model to the pressurized liquefied gas release model allows the automatic linking of outflow resulting parameters as input for the dispersion model. The additional parameters that need to be defined are presented in the table below. These include the definition of release type, meteorological and environmental conditions, and vulnerability settings defining the translation method from physical effects to damage level.
The type of release depends on the release scenario and needs to be selected by the user. For continuous release from process equipment above the ground can only be applied a vertical or horizontal jet.
Toxic exposure duration is based on a defined approach of applying exposure limit. This can be limited by the time needed for sheltering, delayed by the cloud’s arrival at the location or limited by release duration.
The meteorological and environmental conditions will influence and determine turbulence in the atmosphere.
Calculation Method | Dense Gas Dispersion (Outflow below liquid level) | Vapour horizontal jet (Outflow above liquid level) |
Type of release | Horizontal Jet release | Horizontal Jet release |
|---|---|---|
Meteo Definition | ||
Meteorological data | Pasquill | Pasquill |
Pasquill stability class | F (Very Stable) | F (Very Stable) |
Reference height (m) | 10 | 10 |
Wind speed at reference height (m/s) | 1,5 | 1,5 |
Predefined wind direction | W | W |
Environment | ||
Ambient temperature (°C) | 9 | 9 |
Ambient pressure (bar) | 1,0151 | 1,0151 |
Ambient relative humidity (%) | 83 | 83 |
Roughness length description | Open flat terrain; grass, few isolated objects. | Open flat terrain; grass, few isolated objects. |
Vulnerability | ||
Toxic exposure duration based on | Time limit until sheltering | Time limit until sheltering |
Start of exposure (after moment of release) (s) | 0 | 0 |
Max. duration until sheltering (s) | 1800 | 1800 |
Consequence result
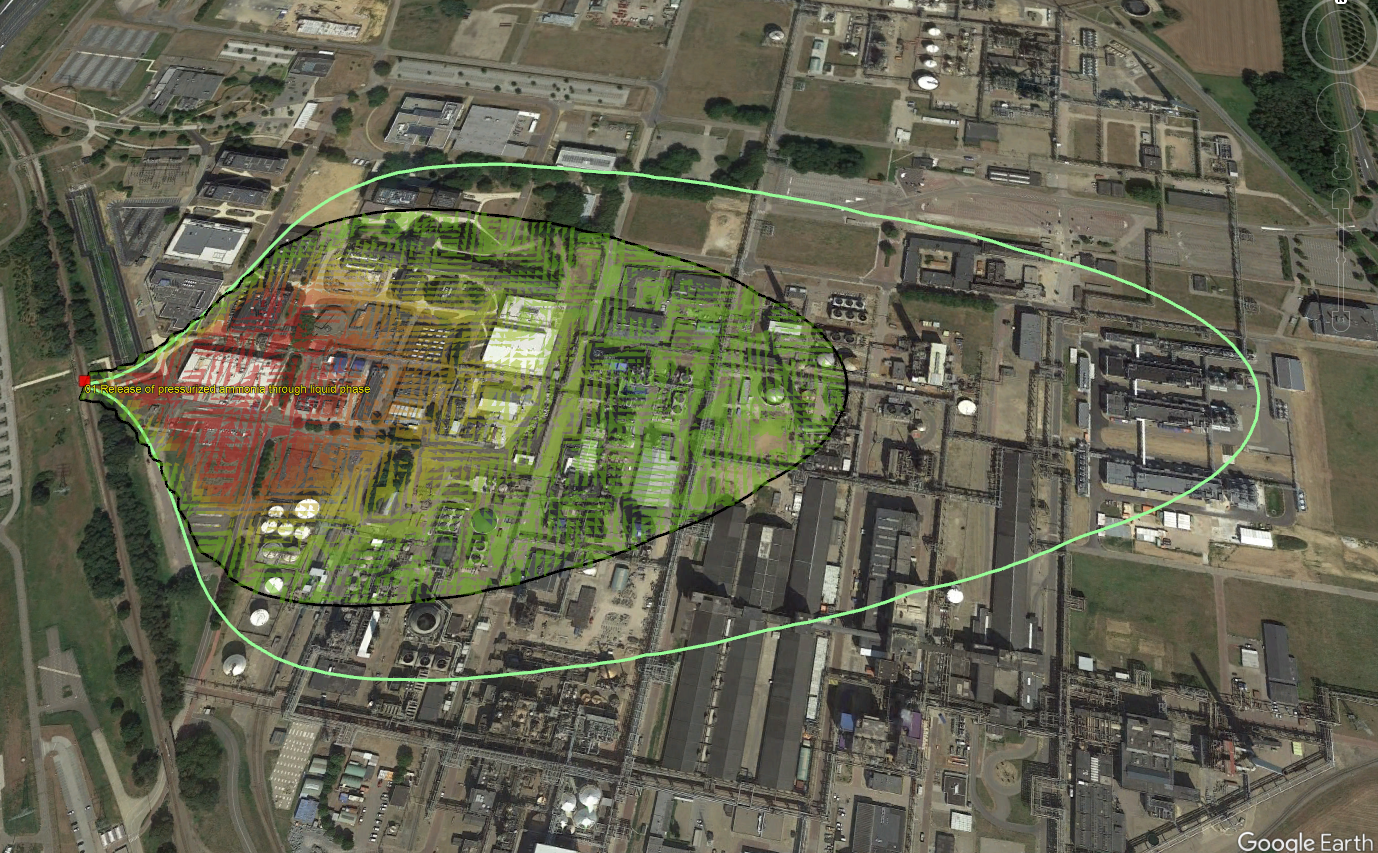
The map visualisation displays the 1% lethality concentration and 1% lethality dose contours of the toxic cloud by default. This data help evaluate:
Expected concentration levels at various distances from the explosion.
Accumulated dose levels at different locations from a source based on changing concentration levels over time.
For a better understanding of the difference between lethal concentration and dose, read the theoretical chapter Toxic dispersion.
.png)
Lethality contours and grid from dispersion model - release of pressurised liquefied ammonia above the liquid level

Lethality contours and grid from dispersion model imported in Google Earth - release of pressurised liquefied ammonia below liquid level
Use a comparison set to evaluate the results of different scenarios. The contours and graphs can be overlaid for easy comparison, while the highlighted differences allow side-by-side analysis of the results in reports.
.png)
Comparison - 1% lethality concentration side plume graph
Conclusion
In the event of a release of pressurized ammonia, most of the mass remains airborne, with little to no rainout occurring. This phenomenon is attributed to the high exit pressure and velocity, which break the liquid into smaller droplets that evaporate easily due to their larger surface area. The expansion caused by flashing creates a heavy, cold cloud with potentially liquid droplets that tend to remain close to the ground.
Our analysis indicates that bottom discharge, which retains a mainly liquid fraction, produces a denser cloud that spreads closer to the ground and over greater distances. Conversely, when vapours are released above the liquid level with few or no liquid droplets, the result is a prolonged release time that forms a lighter cloud. This lighter cloud disperses more easily and poses a reduced risk to the surrounding population.
Download the project file
Explore the project file simulating the ammonia releases. Adjust map contours, select different graphs or multiple graphs at once, and evaluate how different hole sizes influence the received heat radiation dose. Inspect the receiver’s reports to assess the damage effect.
To view the project file, please open it using the EFFECTS software. If you do not have the software, you can download and use the free viewing demo version of EFFECTS via the link below.


.png)
.png)
.png)