- 05 Aug 2024
- 3 Minutes to read
Presentation settings
- Updated on 05 Aug 2024
- 3 Minutes to read
Presentation settings in RISKCURVES influence how results are displayed and affect the entire project, not just individual calculation sets. The defaults for these settings can be accessed and adjusted from the Edit-Options menu to tailor the default display of results to better suit analysis needs.
Coordinate System
Defines the project system for the project file, ensuring consistency in how data is displayed in the map.
.png)
Contour Levels
Contour levels for fire, explosion, and toxic models, are specified centrally in presentation settings. Users can define various contour levels for:
Heat radiation intensity (fire models)
Peak overpressure (explosion models)
Concentrations (toxic dispersion models)
Lethality levels (all models calculating lethality)
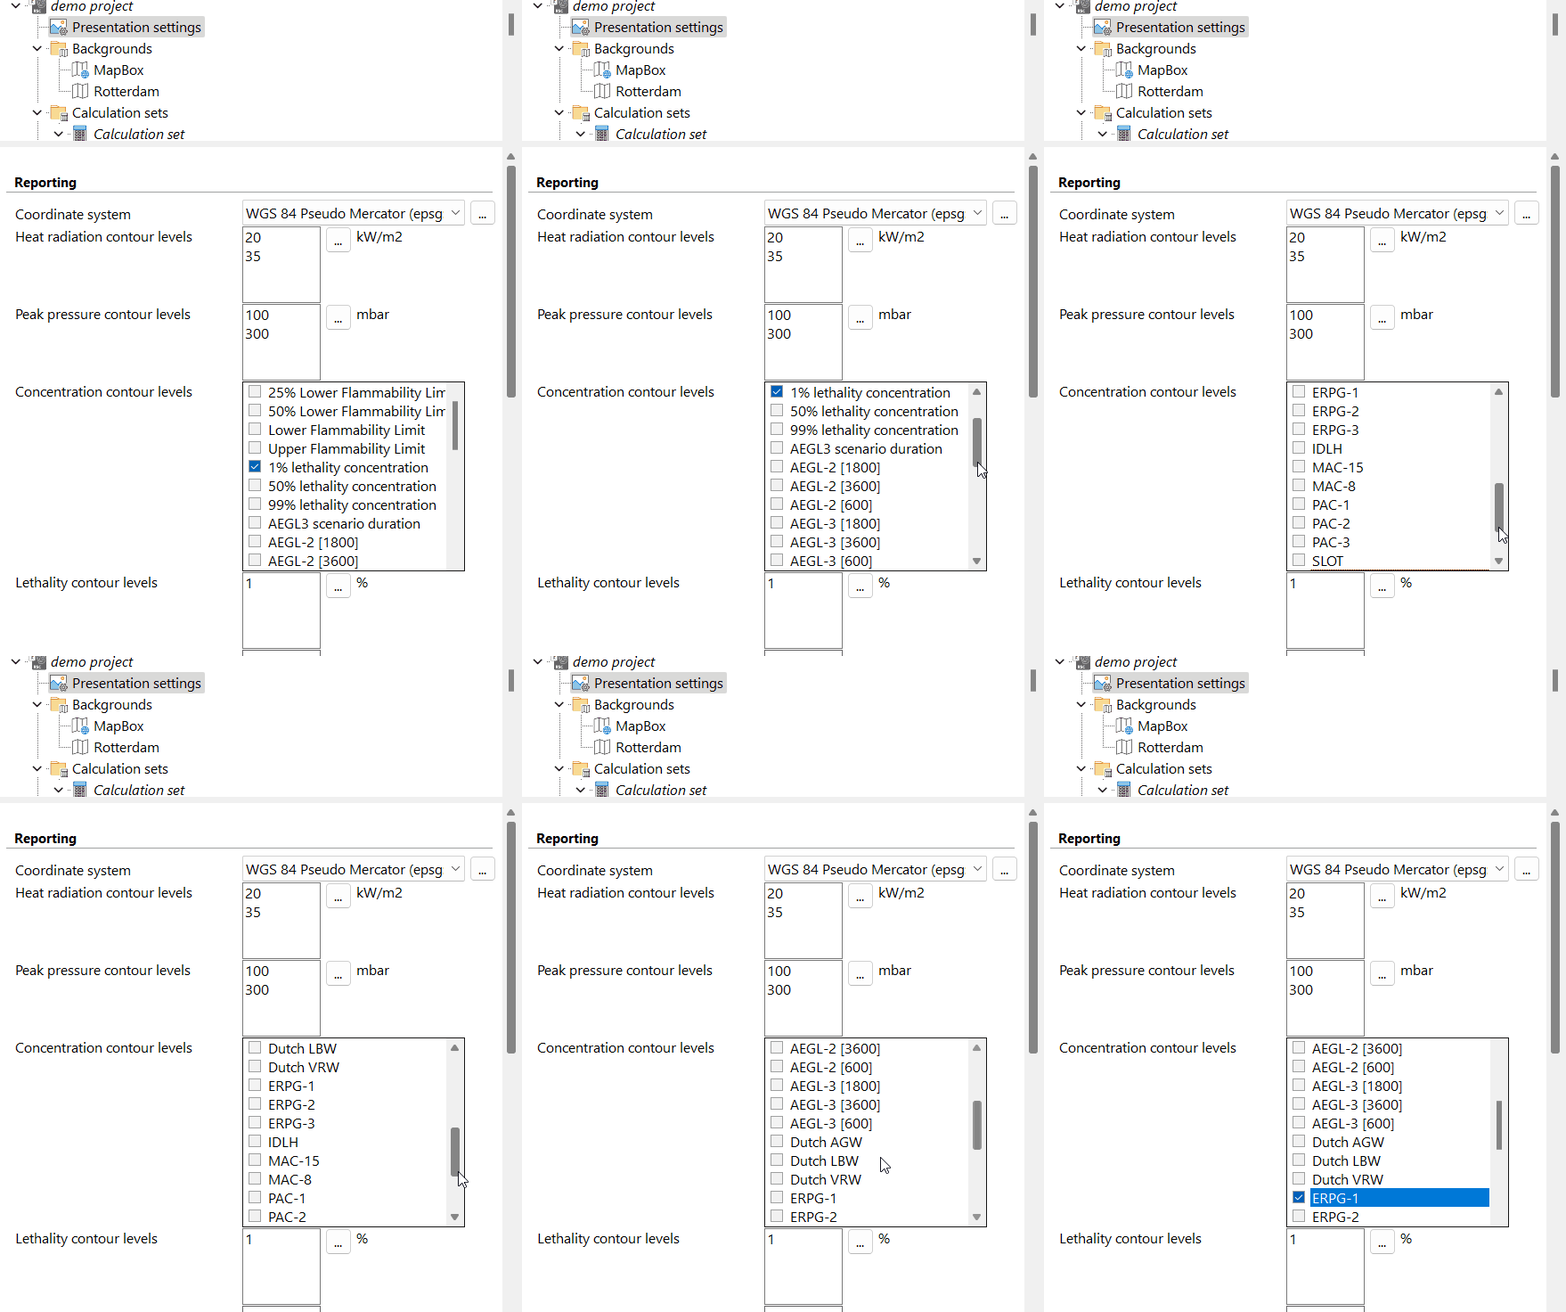
Concentration
Concentration levels are defined using database threshold descriptions. If a threshold is unavailable for a chemical, the dispersion model issues a warning. An additional numerical threshold can also be set. Changes to concentration levels require recalculation due to potential changes in end distances. Dispersion models will appear in italics if concentration levels are changed.
These concentration thresholds will be used as levels for:
Contours shown on the map panel.
Plume side-views displayed in the graph panel.
Calculated contours are shown on the map and detailed in the report, including max. distance, minimum distance (offset), maximum width, and distance to this maximum width. The "contour length" is "max. distance" minus "minimum distance (offset)".

Heat, pressure and lethality contour levels
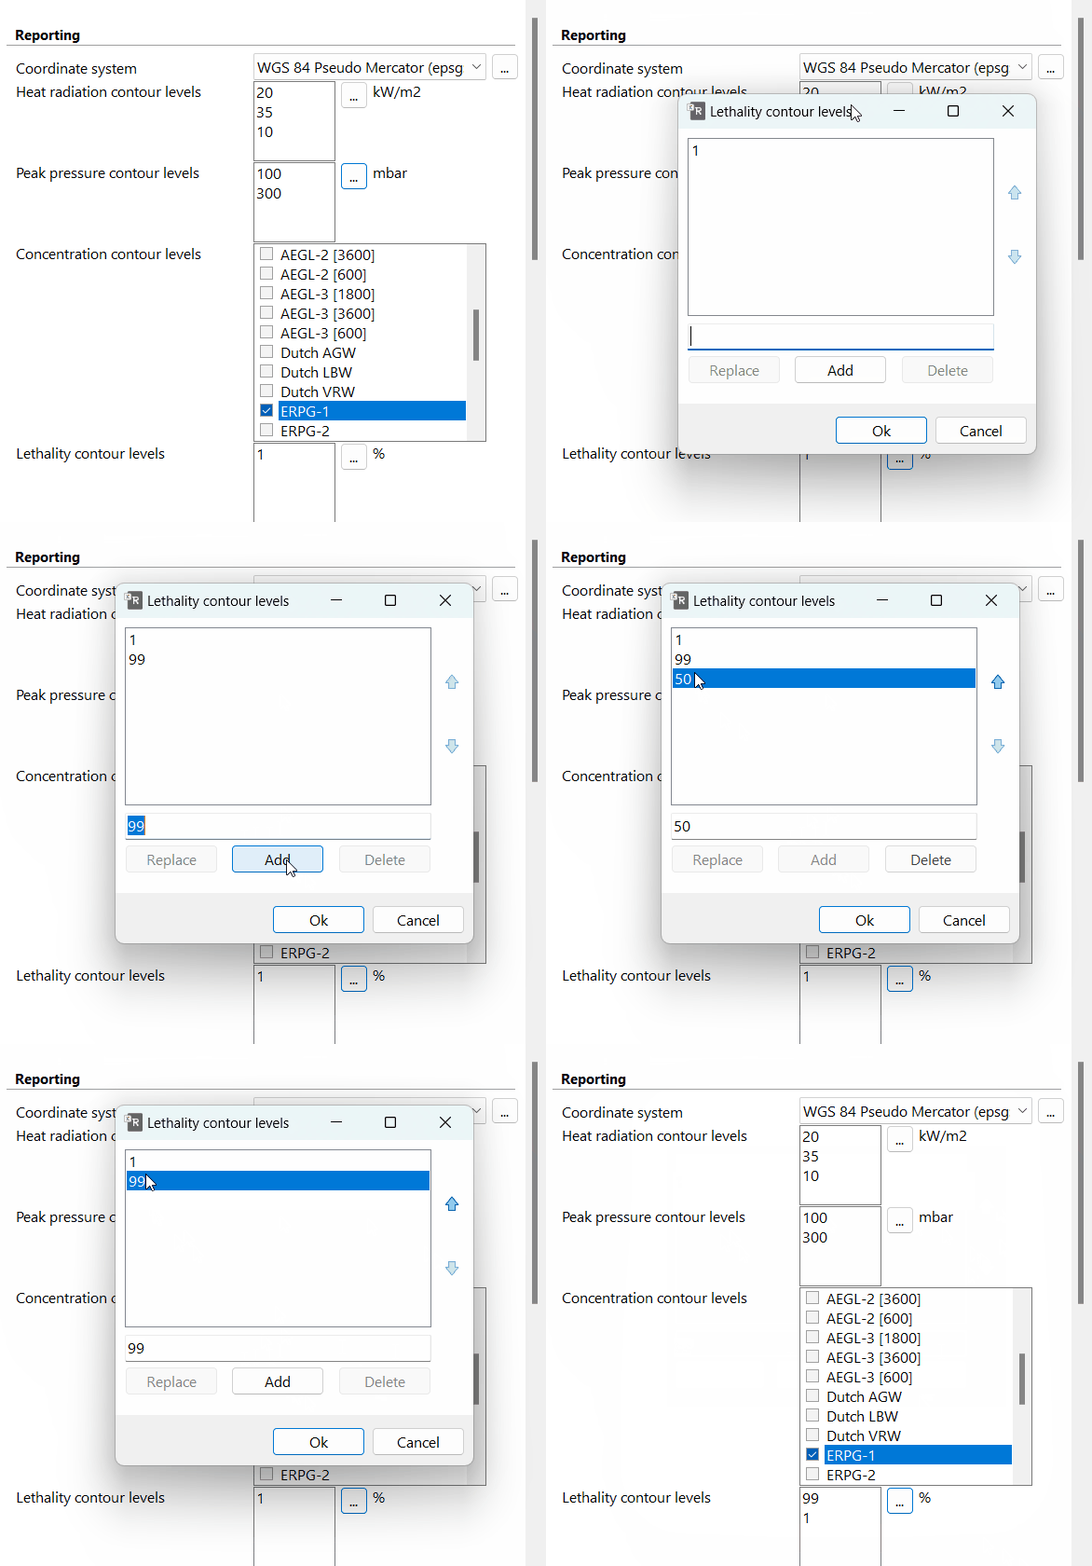
Numerical values for contour levels can be customised using the list editor. To modify these values:
Click the browse button next to the contour levels list.
Type the desired value.
Use the <Add> button to add to the list.
Values can be replaced or deleted after the addition of a specific value.
Use the <↑> and <↓ > buttons to adjust the order of the values in the lenged.

Iso risk contour levels
Used to define multiple levels for Iso Risk Contours, displaying Individual Risk and Consequence Risk on backgrounds and Individual Risk levels used in comparison graphs.
.png)
Lethal fraction max. damage report
Reports include the maximum distance to a specified lethality percentage, displayed as a surrounding contour on the map. Users can specify the lethality level (e.g., 5%, 10%, 99%) to display relevant threshold levels.
Guide value definition
RISKCURVES supports country-specific guide value definitions, shown as a straight line on the Societal Risk fN curve, used as threshold acceptance criteria. Parameters for defining the guide value include:
Guide value starting at # victims: X-axis starting point.
Guide value starting at frequency: Y-axis starting point.
Guide value transport starting at: Y-axis value for transport fN curves.
Guide value maximum # victims: Maximum limit for the number of victims illustrated by a vertical part of the guide value line.
Guide value slope: Slope of the guide value line (e.g., the Netherlands uses slope 2, the UK uses slope 1).
Guide value minimum frequency: Y-axis bottom line frequency (default is up to 10-10/yr).
The distance of the calculated fN curve to this acceptance line is expressed as the "Guide ratio". A Guide ratio of 1 means the graph reaches the guide value exactly. Values below 1 indicate compliance (e.g., 0.1 means ten times lower than allowed), and values above 1 indicate exceeding the guide value.
Changing the guide value definition (slope or starting point) will change the Guide ratio result.
Victim category for risk ranking
The risk ranking report based on Societal Risk includes a ranking taken at the "highest level" for any specific N category. Societal risk ranking can be presented for any user-defined number of victims (e.g., 100 or 1000). This secondary risk ranking category is user-definable.
Transport fN curve section length
The section distance for Societal Risk fN curves for transport risks can be adjusted, with a default length of 1 km. Risks can also be accumulated for the entire route.
Colour legend translation of grids
The colour legend for specific grid presentations can be defined, allowing users to set minimum and maximum levels, number of levels, and colour range to represent a (risk) value in a colour. For lethality levels, it is recommended to use a scale from 0.01 (1%) to 1 (100%).
.png)
.png)
Colour palette
Defines the colours used in the graph displays of models and comparison sets, allowing for visual customisation to better interpret and differentiate results within the graphs.
By configuring these presentation settings, users can tailor the display of their results to better suit their analysis needs and preferences, ensuring clearer, more informative visual outputs for effective decision-making and communication.

