- 17 Dec 2025
- 2 Minutes to read
Menu bar
- Updated on 17 Dec 2025
- 2 Minutes to read
The menu bar provides users with essential controls for managing projects, adding models, and accessing tools. Designed to resemble common MS Windows applications, the menu bar ensures a familiar and intuitive user experience. Here is a detailed overview of the main menu items and their functions.
.png)
Menu bar
Navigating through the menu bar
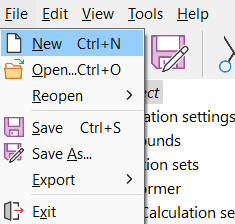
File menu
The File menu offers options for project management:
New: Create a new project from scratch.
Open: Load an existing project.
Reopen: Quickly access recently opened files, enhancing workflow efficiency by remembering the last few opened files.
Save: Save the current project with its existing name and location, ensuring all recent changes are stored.
Save As: Save the current project with a new name or to a new location, creating a separate file.
Export: Export consequences to a .csv file, contour dimension or generate a full project report including numerical results of all scenarios, identical to the report contents.
Exit: Close the VES application.

File menu
Edit menu
The Edit menu contains standard clipboard operations:
Cut / Copy / Paste: Move or copy data within the application or to external documents. Users can copy different data types, such as profiles, GIS screen contours, or HTML reports, to the clipboard for easy pasting into other documents. Note that a clipboard can only hold one type of data at a time.
Options: Access the Options screen to customize application settings. This menu item opens a detailed options screen for further configuration. Examples of functionality available include changing default expert parameters, adding a user-defined chemical database, changing the software’s language, setting default display units, etc.
.png)
Edit menu
.png)
Edit - Option menu
View menu
The View menu offers settings to customize the display:
Mode: toggle between different complexity modes to adjust the level of detail.
Simple: Display the most basic parameters that will influence the most results of the calculation.
Normal: Shows a moderate level of detail.
Expert: Reveals all input parameters that influence the calculation, providing the highest level of detail.
Graph: Enables graph functionalities. Note that all these settings can also be activated using toolbar buttons.
Contour: Enables map functionalities. Note that all these settings can also be activated using toolbar buttons.
Clear contour settings: Resets all contours in the project to their default settings.
.png)
View dropdown menu
Tools menu
The Tools menu provides access to useful calculators and converters:
Mass and Volume calculator: Calculate mass and volume for different substances taking into account their physical state at the given process conditions.
Mortality/probit calculator: Assess the mortality rate or probit function for toxic scenarios.
Probit converter: Convert probit values to other units.
.png)
Tools dropdown menu
Help menu
The Help menu contains resources and support options:
Contents: Access the help file, which provides extensive information about how to use the software, including definitions of input and results parameters available in the software user interface. All input and results parameters in EFFECTS and RISKCURVES are linked to this help file.
User manual: Access the comprehensive user manual for guidance.
License documentation: Review license details and documentation.
Version information: View the latest additions and changes to the software.
Contact Helpdesk: The technical support is available for all users with an active license.
About: Display the current version number and the remaining license duration.
.png)
Help dropdown menu
This menu ensures users have the resources they need for troubleshooting and understanding the software.
Conclusion
The RISKCURVES menu bar is a pivotal part of the user interface, streamlining project management, model execution, and tool access. By familiarising yourself with the File, Edit, Model, View, Tools, and Help menus, you can efficiently navigate the software and fully leverage its capabilities. Understanding these options ensures that you can manage projects effectively, run accurate models, and utilise helpful tools and resources, ultimately enhancing your overall workflow and project outcomes.

