- 05 Aug 2024
- 3 Minutes to read
Map
- Updated on 05 Aug 2024
- 3 Minutes to read
The Map tab in the RISKCURVES user interface provides a GIS presentation of all geographically oriented results, optionally above a background map. This tab is crucial for visualizing various phenomena and risk contours.
Zoom in and Zoom out
Drag method: Hold the left mouse button and drag the mouse from top left to bottom right to zoom in. Hold the left mouse button and drag from bottom right to top left to zoom out.
Mouse wheel: Scroll the mouse wheel to zoom in and out.
Results visible on the background maps
Depending on the node and weather class selection, the map display panel can visualise the following:
Individual Risk contours
Individual Risk grid
Societal Risk maps
Risk transect
Heat radiation contours and grid (top and side view)
Pressure level contours
Concentration contours and grid
Dosage contours and grid (outdoors and indoors)
Lethality contours and grid (outdoors and indoors)
Flame shapes
and more
Navigating through the results
Legend
The legend area allows you to see all map layers as checkable items. The floating panel can be resized and docked to the right side of the map.
Missing legend?
If the red "close" cross has been pressed, the panel can be activated again by selecting menu "View > Panels > Legend"
Layer ordering
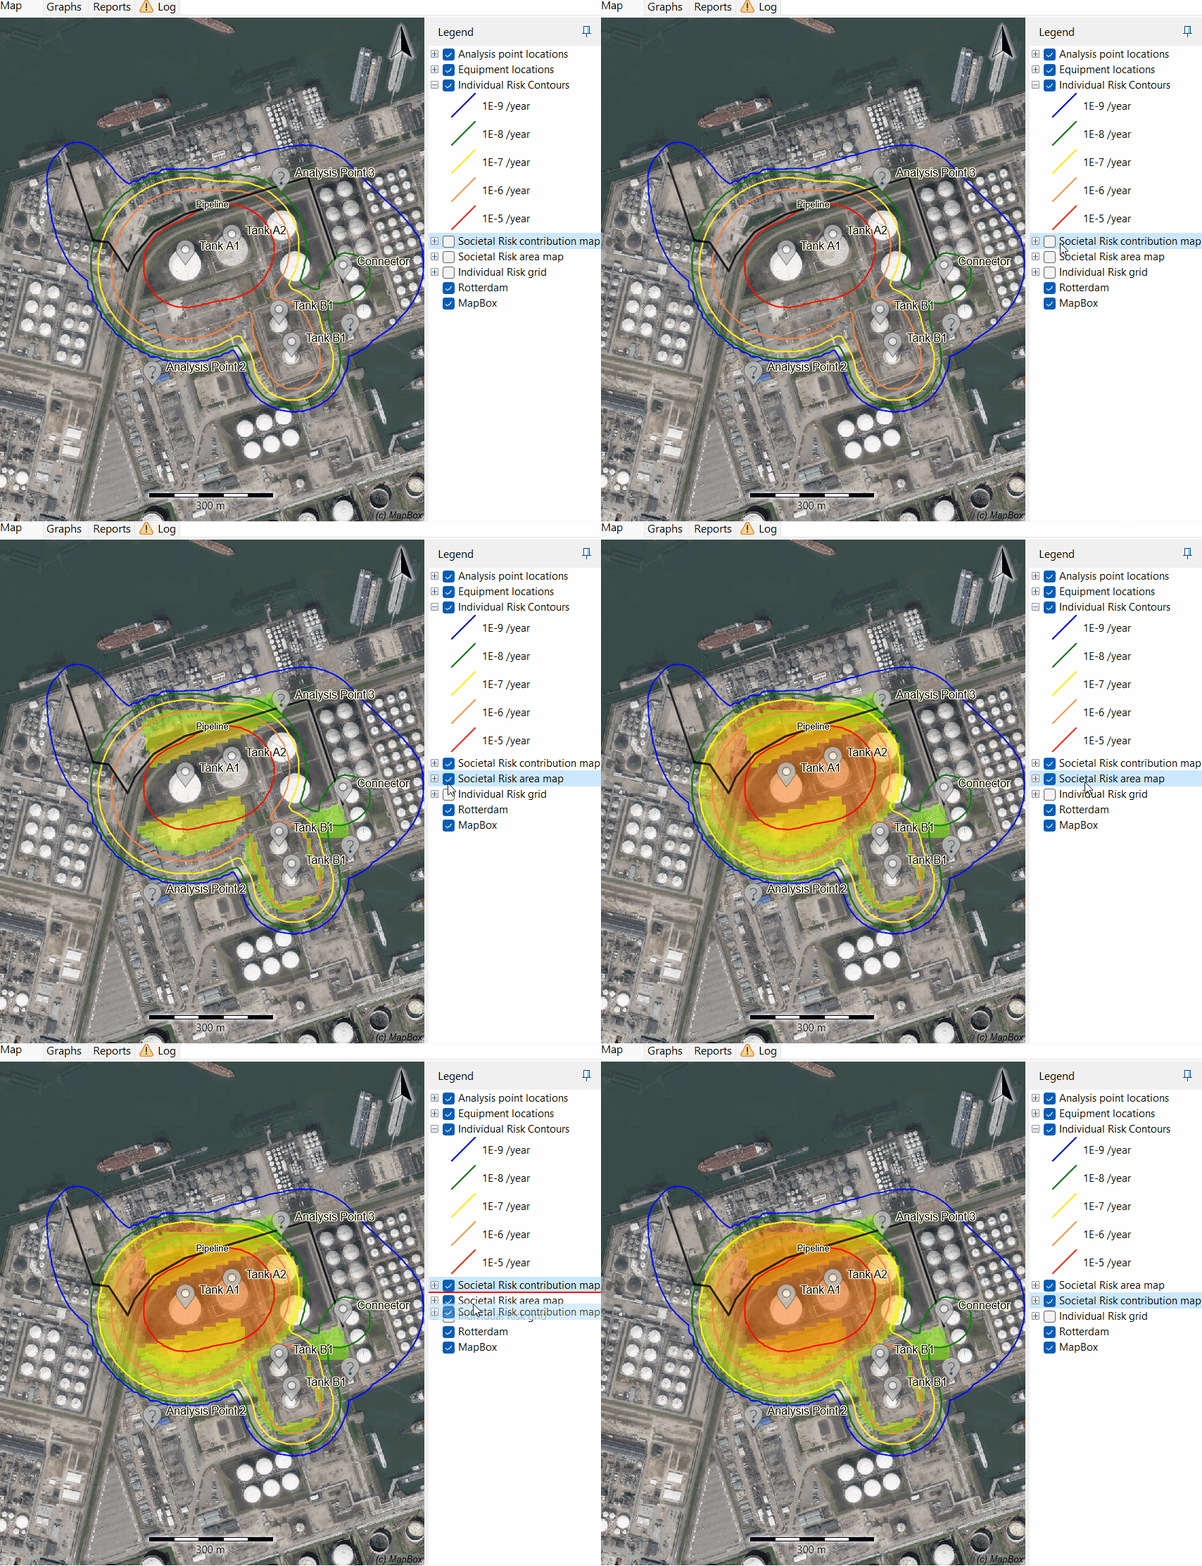
The order of the legend items matches the layers on the map. Since (filled) contours can obscure information, you can reorder them by clicking on a layer, holding (to activate functionality), and dragging them into the preferred order. Note that a background map should remain as the bottom layer.
Watch the animation below presenting these functionalities.
Issues with the order of map layers?
Note that a background map should remain as the bottom layer. For more information, read the section Backgrounds.

Contour properties
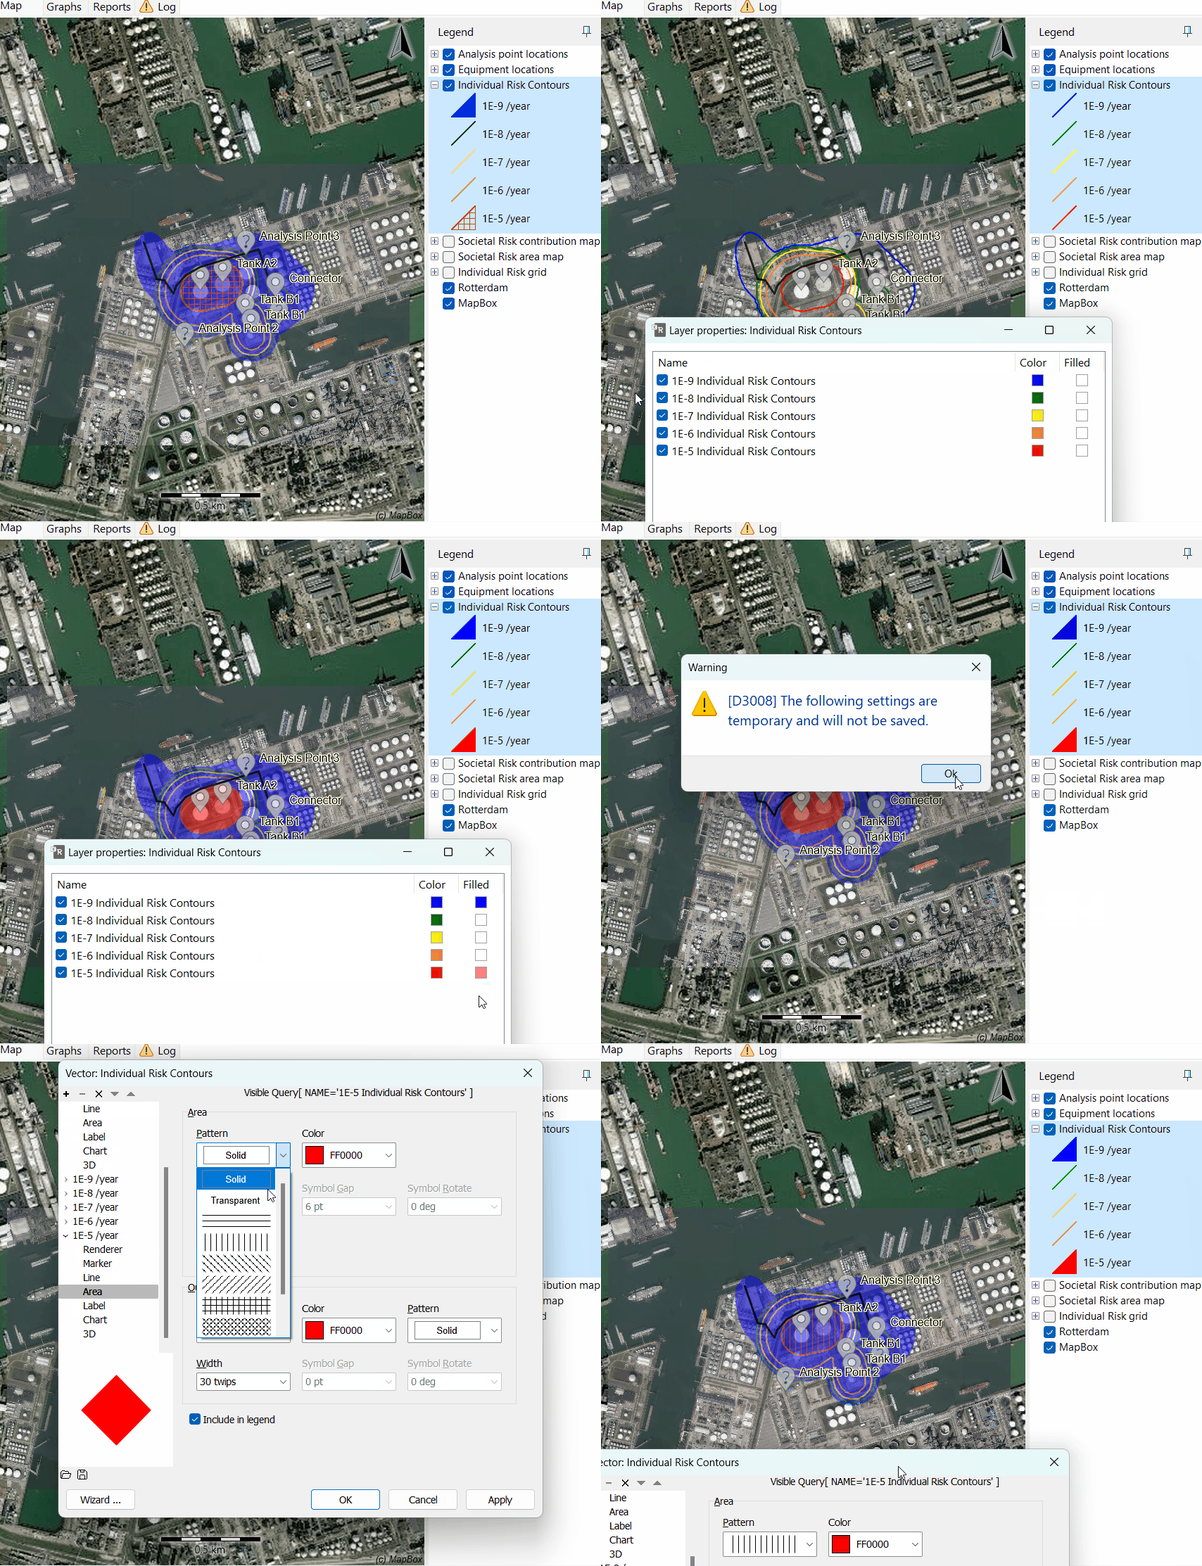
You can change the colours, transparency, and filling of contours by double-clicking on the layer. Advanced properties can be adjusted in the expert dialogue, although these settings are temporary. Watch the animation below presenting these functionalities.

Grid display
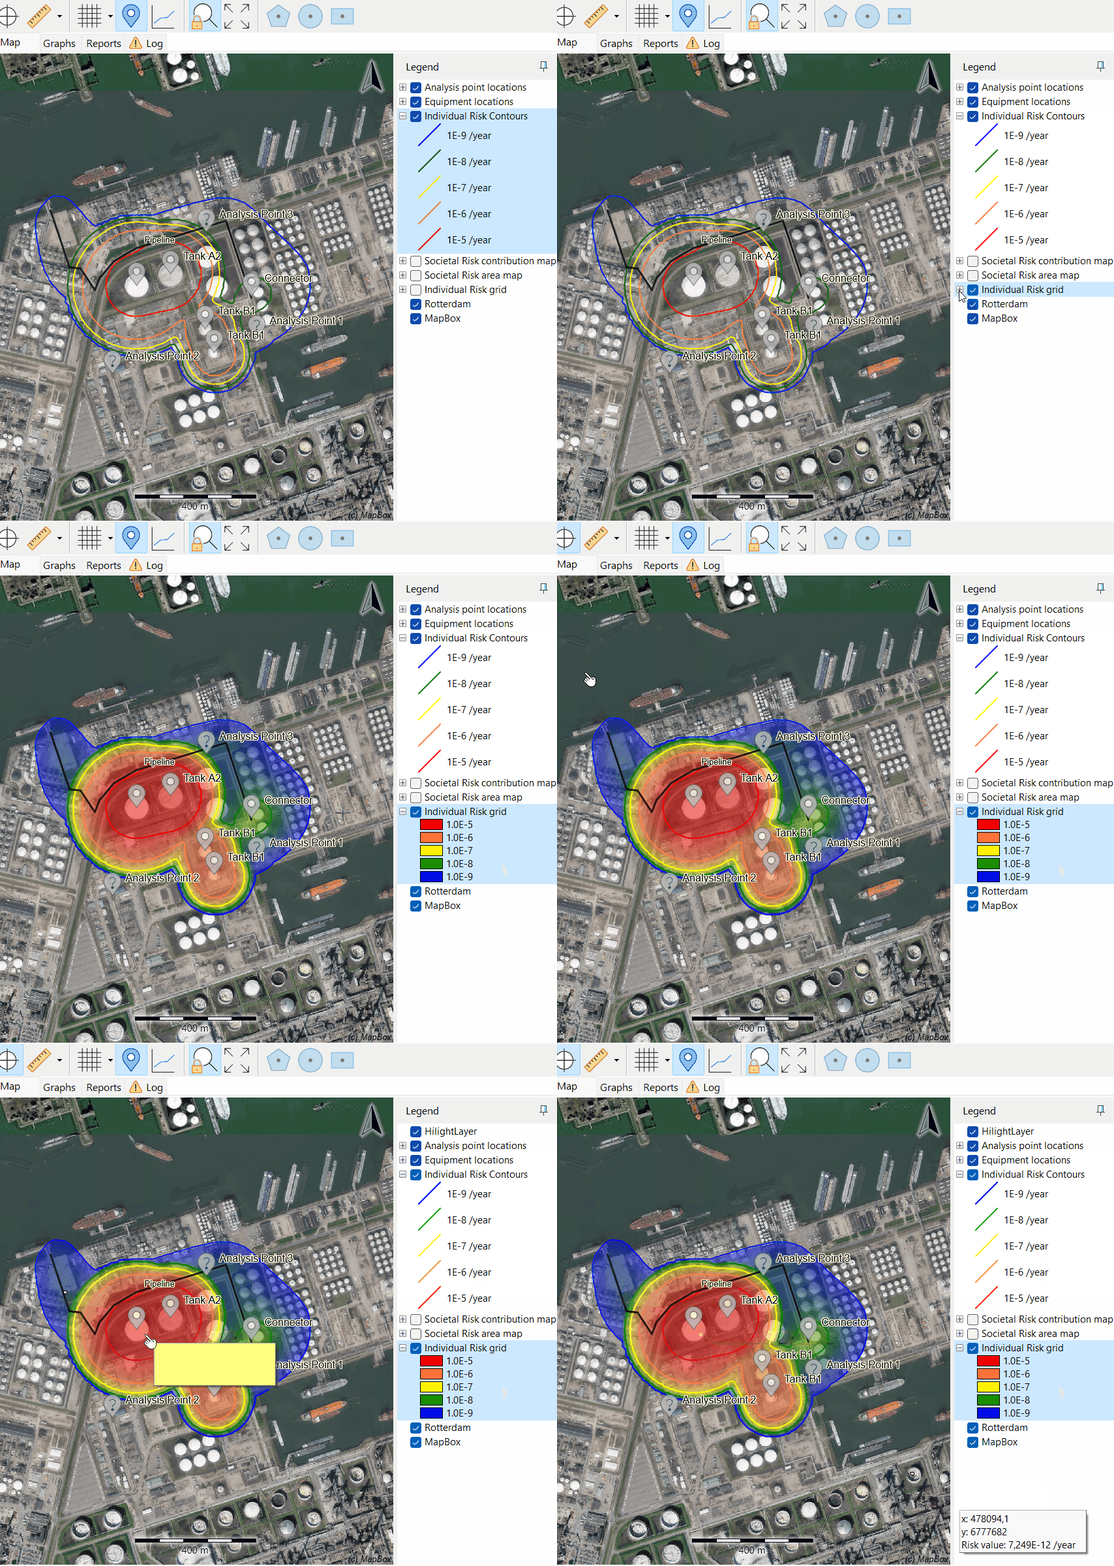
Individual risk results can be presented as a grid with colours ranging from red to blue. Note that the colours of the grid can be changed in presentation settings. After selecting a model and a weather class, the user can access the same consequence results as in EFFECTS.
Note
The risk grid is only visible when Expert mode is selected.
The cross-hair tool reveals values at the cursor if the grid layer is active (see animation below). Double-clicking on the corresponding legend layer will reveal the colour translation editor, identical as for the contours. Watch the animation below presenting this functionality.

Surrounding contours
If consequence results are being viewed, the legend pop-up menu (accessed by right-clicking on the legend) allows for the illustration of "surrounding contours".
Export
Various export formats are available, depending on the type of layer (contour or grid):
Contours: KML/KMZ (Google Earth), Shapefile, GeoJSON.
Grids: KML/KMZ, ESRI ASCII grid (ASC, GRD), ESRI binary (FLT), image format (JPG, TIF, BMP).
.png)
.png)
Freeze layer
This functionality allows you to display the contour or grids of multiple models without creating a comparison set. The map always presents the contours and grids of the current active selected model, and the comparison set allows to comparison of any combination of contours or grids.
To freeze a specific GIS layer, select <Freeze layer copy>, which will not react to switches of the active model or project. To remove this layer, use the legend pop-up menu <Delete layer>.
.png)
Contour tools
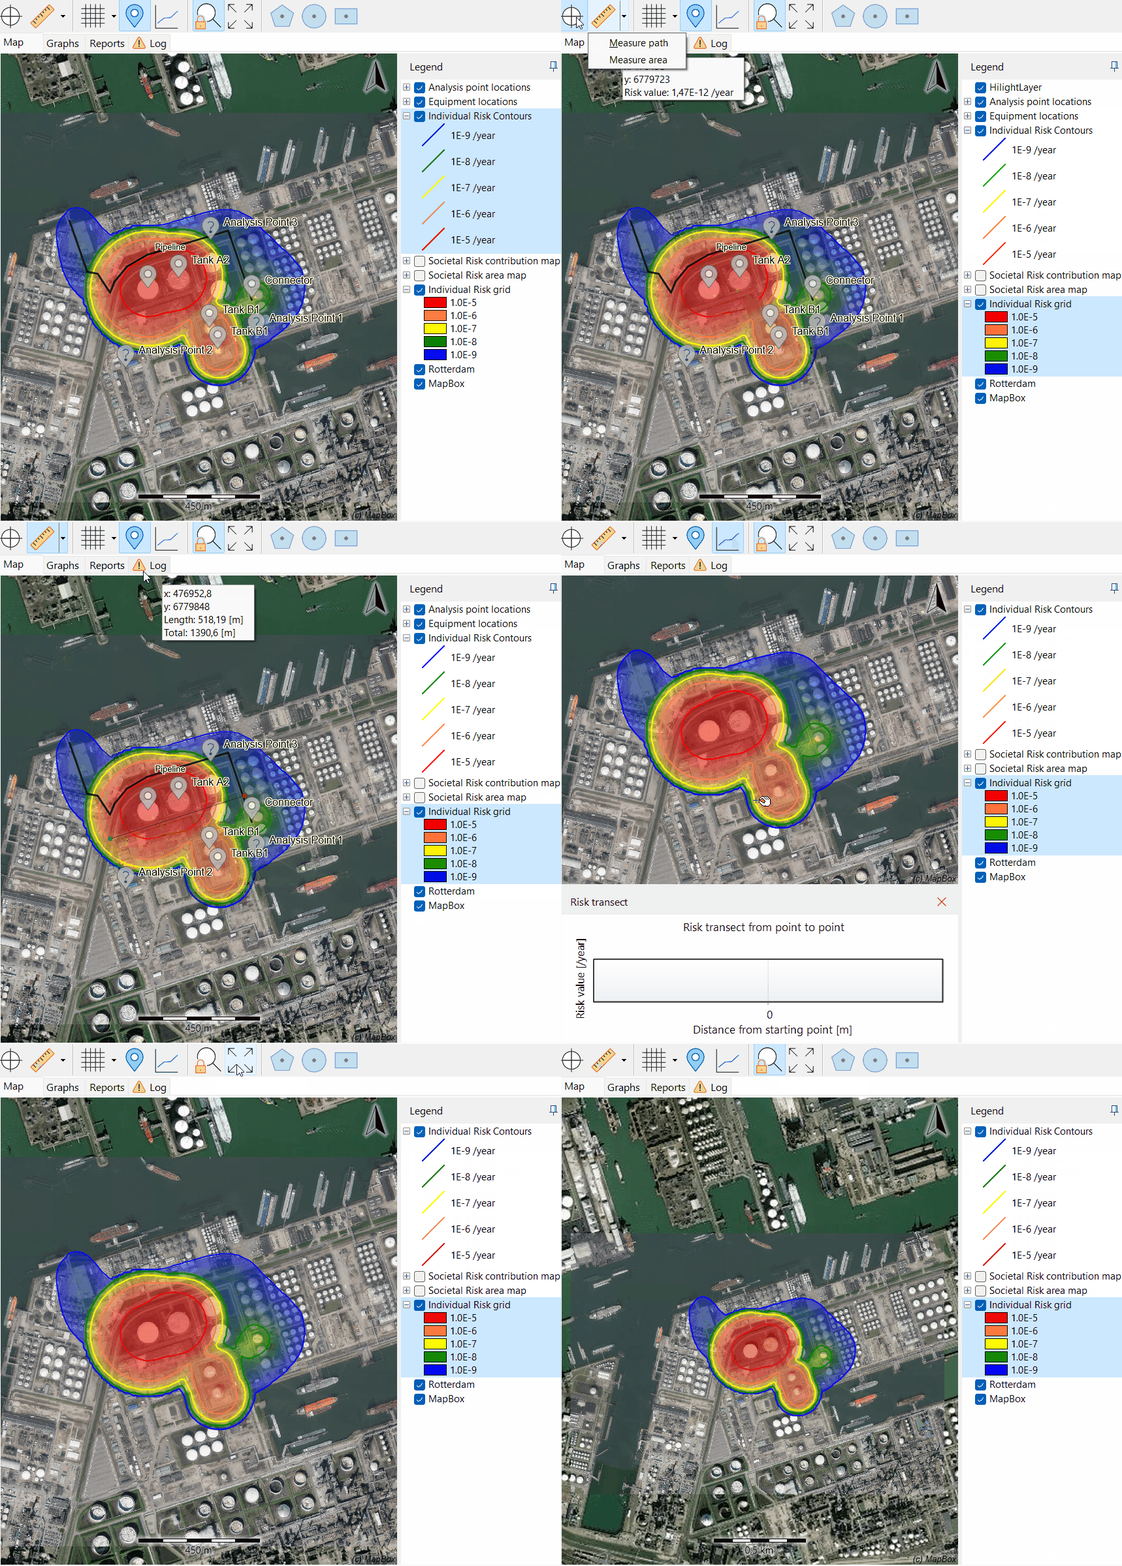
The contour viewer supports zooming and scrolling with mouse shortcuts (the same way as the profile graphs). These toolbar buttons can be used for specific features:
Cross-hair: Illustrates the coordinates and value of the location at the cursor if a grid layer is active (selected in the legend).
Ruler: Measures absolute sizes of clouds, areas, or distances on a background map.
Grid tool: Shows a grid definition in the contour, useful for reading out positions.
Release point: Indicates the location of accidental spill in the map.
Lock Zoom: Locks the map view.
Zoom map to full extent: Fits your full contour view into the map window.
Note that all these tools can also be accessed through the Toolbar. Watch the animation below presenting these functionalities.

Pop up menu
Right-click in the contour area opens a pop-up menu storing many functionalities. An added functionality compared to the EFFECTS pop-up menu is that you can draw a Risk transect.
.png)
Contour views can be saved as files using the following formats:
.png)
By utilizing these features effectively, you can enhance your analysis and interpretation of geographically oriented results in the RISKCURVES user interface.


.png)