- 11 Jul 2024
- 3 Minutes to read
Flowvis
- Updated on 11 Jul 2024
- 3 Minutes to read
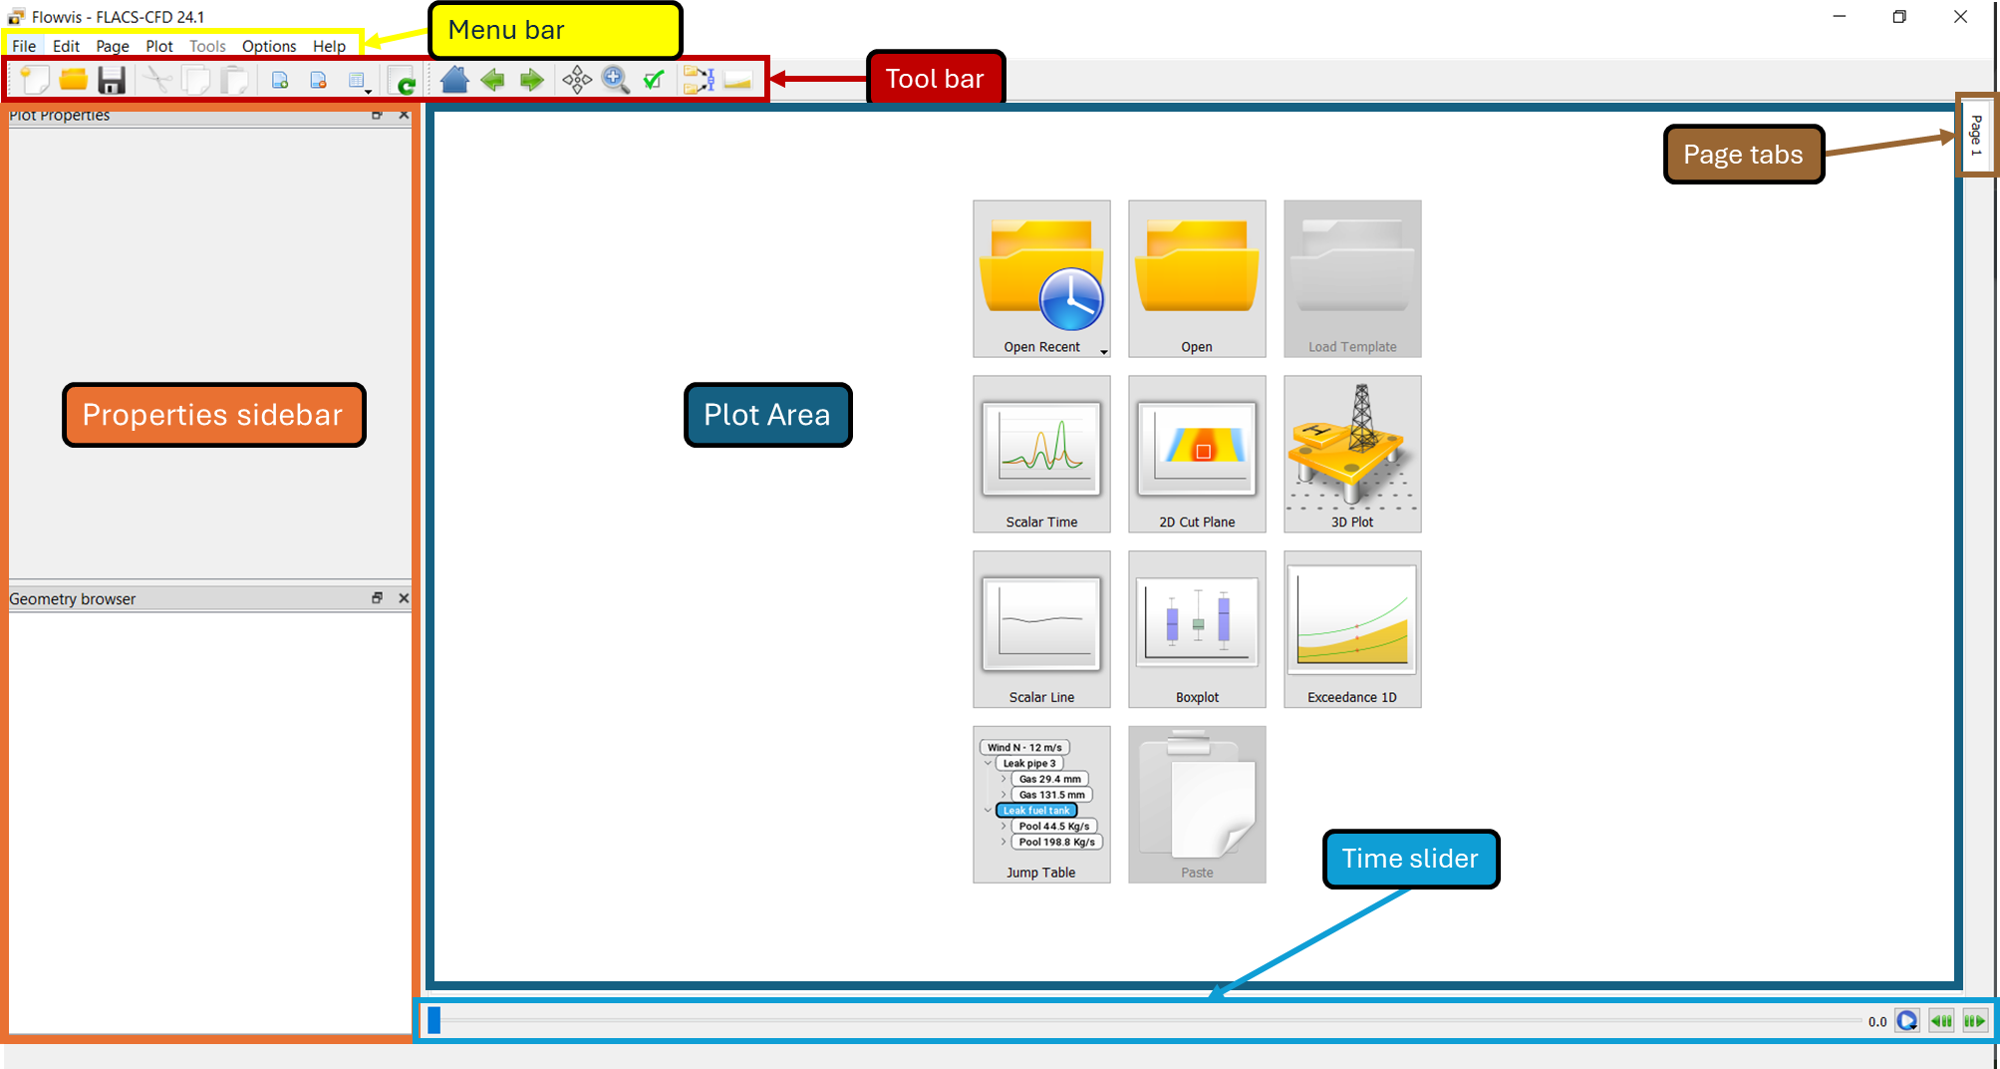
The main Flowvis window consists of the following:
Menu bar
Tool bar
Properties sidebar
Plot area
Time slider
Page tabs

Menu bar
The menu bar contains the available menus:
File - contains commands for opening, saving, and exporting presentations.
Edit - involves commands that manipulate pages and plots.
Page - collects commands to administer pages.
Plot - offers commands for creating and editing plots.
Tools - comprises the porosity verification functionality of Flowvis.
Options - contains toggle buttons for various options and gives access to advanced settings.
Help - gives access to help and documentation about Flowvis
Tool bar
The following options are provided in the tool bar and are shown in the annotated image below:
New - creates a new presentation.
Open - opens an existing presentation.
Save - saves the presentation.
Cut - removes the selected plot from its location and is temporarily saved to the clipboard.
Copy - copies the selected plot onto the clipboard.
Paste - pastes a plot from the clipboard.
Add page - creates a new page in the presentation.
Delete page - deletes the current page.
Page subdivision - sets the page layout: Several plots can be arranged in a grid on one page. Each plot can also span multiple cells of the grid.
Reload data - reloads the data from disk. Useful if a plot shows results from a running simulation.
Go home - resets the current plot to the default view.
Go to previous view - returns to the previous view for the current plot (possible for zoom and pan operations in 1D and 2D plots).
Go to next view - advances to the next view for the current plot (possible for zoom and pan operations in 1D and 2D plots).
Pan - allows to move the plot region.
Zoom - enables to zoom in to the subsequently marked portion of the plot.
Figure options - opens the figure options dialogue.
Create an aggregated result based on several runs - opens the Aggregation dialogue.
Compute exceedance values

Properties sidebar
The properties sidebar shows the settings for the selected plot. The sidebar can be detached from the main window, or moved to a different location, by dragging it. The properties which can be set depend on the plot type selected.
If the plot properties sidebar is closed, then you can retrieve it by right-clicking in the grey area of the menu bar or tool bar. This will open the context menu where you can re-enable the plot properties entry.
Plot area
The plot area shows the results of a simulation in the format of the plot type selected. The plot area can have multiple pages and each page can contain multiple plots.
Creating a page with multiple plots by selecting Page subdivision.
Create a new plot within a page - once the page has been subdivided, additional plots can be added by right-clicking on the empty plots.
Set span - right-click and select set span to set how many cells in the plot layout the selected plot will cover.
Display header - navigate to the options menu and toggle on or off the Header on option.
The header can be changed within the Page Settings dialogue box of the Page menu.
Time slider
The time slider has two modes that can be toggled by activating or deactivating Synchronize Time within the Options tab.
In synchronised mode (default), the time for all plots on a page is the same, the tick marks of the time slider indicate the beginning of each time step. Dragging the slider selects a point in simulated time.
When Synchronize Time is deactivated, the time slider selects time steps and the markings along the slider are equally spaced rather than based on the time step length. On a page with plots of different scenarios, the plots may then show different times, since a certain time step may refer to different times in the different datasets.
The animation speed playback within Flowvis can be set by holding down the play button on the bottom right.
Page selection
If several plots are gathered in one presentation then these are accessed via tabs along the right hand side border of the plot area. The page names can be changed either per page or for all pages by specifying a template in the Page Settings dialogue box from the Page menu. The naming template may use variable text elements like the page number, the presentation file name, or the current date. Pages can also be dragged and dropped in the tab bar to rearrange their order.

