FLACS2RC tool demonstration
- 24 Dec 2025
- 3 Minutes to read
FLACS2RC tool demonstration
- Updated on 24 Dec 2025
- 3 Minutes to read
Article summary
Did you find this summary helpful?
Thank you for your feedback!
FLACS2RC is a tool for bridging the gap between CFD and QRA by streamlining the integration of FLACS results into RISKCURVES software. The tool supports this process by automatically converting asymmetric FLACS consequence contours into symmetric geometric shapes (ellipses or circles) that RISKCURVES can interpret.
In summary this tool enables:
Conversion of FLACS consequence contours (flammable clouds, toxic dose zones, blast overpressure) into simplified footprints for use in RISKCURVES
Reduced manual effort in approximating CFD outputs for risk assessment
Effective representation of CFD-derived hazard extents in risk models
The FLACS2RC tool and the associated technical documentation can be found here. The tool is available for Windows and Linux operating systems.
Installing the tool for the first time
After downloading the tool using the link above, extract the zip folder contents to a suitable location. Prior to using the tool, users should review the text files provided: a ‘read me’ file with general information; release notes; licensing information; and a disclaimer.
To use the tool, open the application e.g., ‘flacs2rc-1.0.1-windows-flacs25.1.exe’ (or similar, depending on operating system and the release version).
Using the tool
FLACS2RC takes the output of a FLACS simulation, such as: a gas concentration contour at the Lower Flammable Limit; a toxic dose contour; or an overpressure isobar and fits a simple geometric shape (typically an ellipse or a circle) that approximates it. The goal is to capture the primary extent of the hazardous footprint (length, width, orientation) in a way that can be communicated to RISKCURVES.
To extract a simplified contour from FLACS results for use in RISKCURVES, follow these steps:
Run the FLACS simulation, outputting relevant 3D data
Open the FLACS2RC tool and load the simulation results
Generate the contour
Fit an ellipse or circle
Review the fit
Export the contour parameters
Repeat for relevant scenarios
Import into RISKCURVES
Loading simulation results
To load the simulation results into FLACS2RC, perform the following steps:
Open the FLACS2RC application
Check ‘FLACS Location’ points to where FLACS is installed (by default this should be something similar to ‘C:\Program Files\Gexcon\FLACS-CFD_25.3\bin’)
Navigate to the required simulation to import the results via ‘Input File’.
Generating the contour
To generate a simplified contour based on the FLACS results, perform the following steps:
Define the ‘Source Point’: this should be defined as the origin of the hazardous event i.e. the release point for dispersion simulations or a position within the fuel region for explosion simulations.
Select the ‘Time Step’ (i.e., seconds in simulation time): the user can specify which simulation time step in the results file the contour should be based upon.
Choose the ‘Variable’ to display: the footprint of a number of different 3D outputs can be selected such as the gas concentration, pressure and temperature.
Set the ‘Target Value’: based on your required threshold. For example for the mole fuel fraction (i.e., gas concentration), the target value could be set to the LFL concentration (see note below).
Set the ‘Height (m)’: specify the lower and upper cutoff heights to perform the calculation.
Update Contour: once the contour settings have been defined, the contour can be generated.
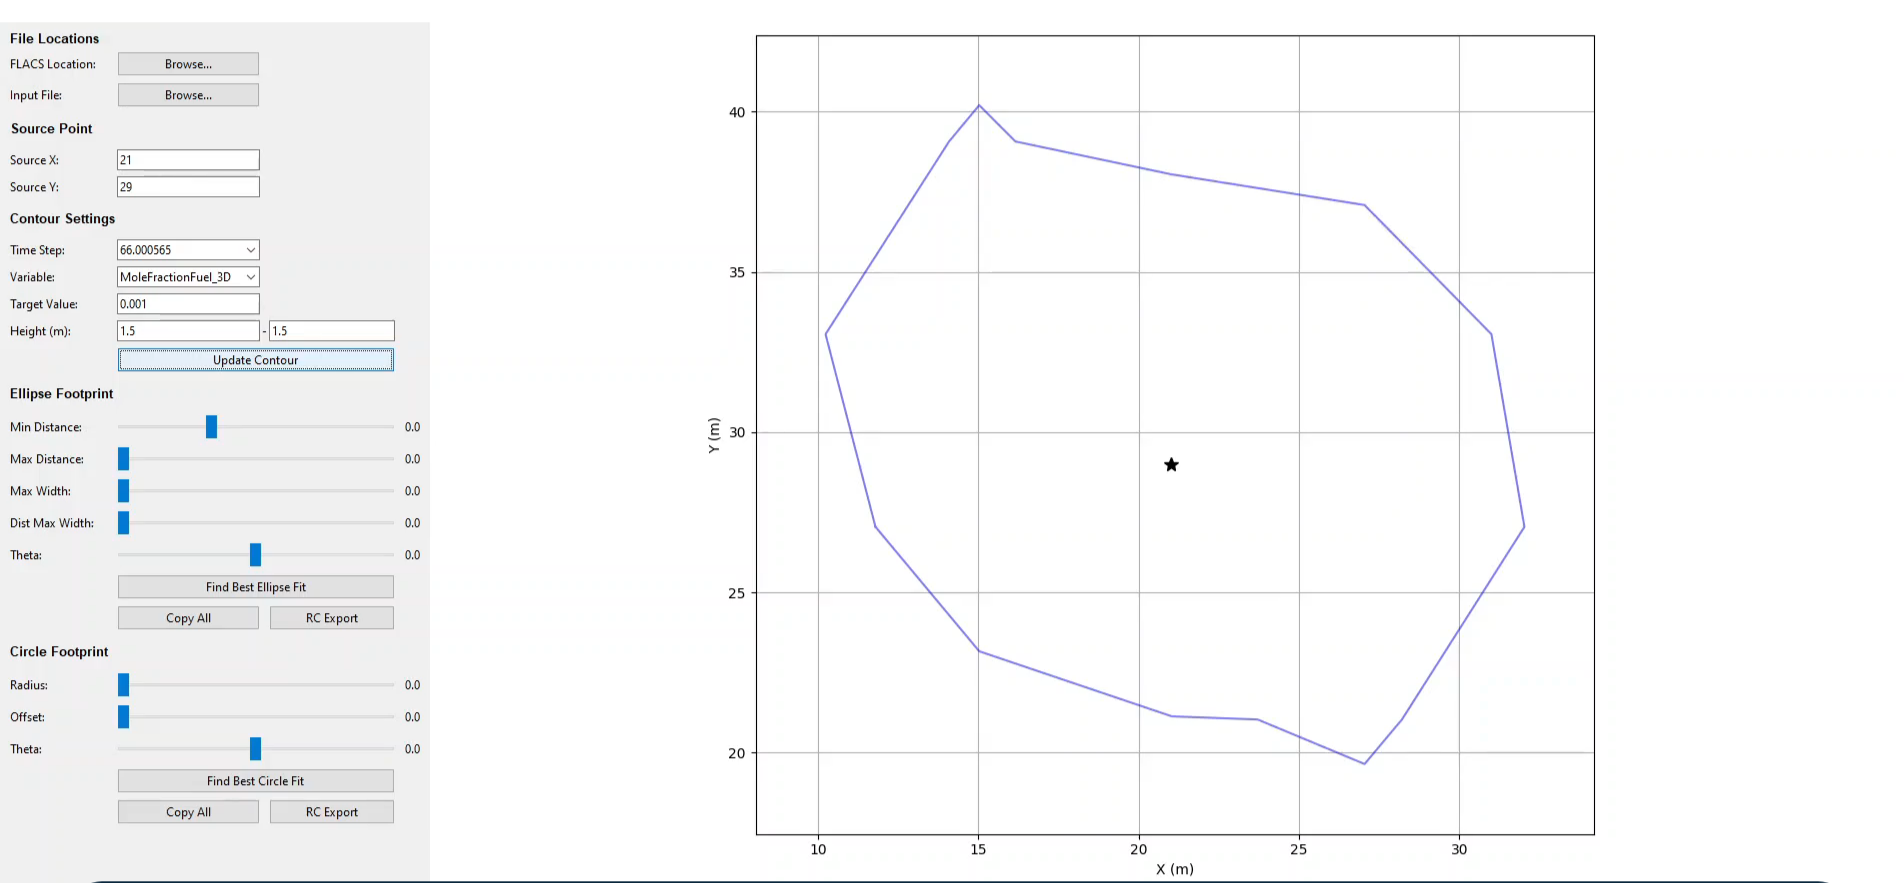
Example contours produced for a specified variable, time step, target value and height
Note
The target value must be specified in using default units of the output parameter. For example, the MoleFractionFuel_3D default unit is m3/m3. Therefore, to set the target value to the LFL of methane, you would need to enter 0.05 (~5%). The default units for the output variables can be observed in CASD or in the cs file.
Fitting an ellipse or circle
Select the fitting option: either ellipse or circle based upon the hazard considered (i.e. select a circle fit for explosion overpressures and an ellipse fit for dispersion results).
Review and manually edit the fit: inspect how well the ellipse or circle covers the FLACS contour. The footprint sliders can be used to tune the generated shape to improve the fit or ensure conservatism.
.png)
Sliders which can be used to manually adjust the footprint
Export the simplified contour
This data can now be exported by copying to the clipboard in one of two ways:
Copy All: simple text format
RC Export: format compatible with the RISKCURVES input spreadsheet and consequence definition
.png)
Export options in FLACS2RC
Import into RISKCURVES
In RISKCURVES you are able to import data using either using the footprint import wizard or by manually defining a footprint for a specific scenario.
The footprint import wizard allows you to import scenarios from a spreadsheet. It is advised to apply the steps to export the “import spreadsheet template XLS” to use the predefined columns structure for various scenario event types supported in RISKCURVES. This is described in the Knowledge Base, here.
To add footprints manually see the knowledge base article here.
Importing dispersion contours
Note, the contour does not need to be rotated. For example, when importing a dispersion contour for F2 wind conditions, this will automatically be rotated in all wind direction based on meteorological data probabilities.
Demonstration video
Was this article helpful?