- 30 May 2024
- 1 Minute to read
Displaying Risk Transect
- Updated on 30 May 2024
- 1 Minute to read
About Risk Transects
Risk transects are graphical presentations of the Individual Risk along a defined line on the map. This tool helps in understanding how the risk varies across a specific path or area within a site, providing a visual representation of risk levels along the transect.
Adding a Risk Transect
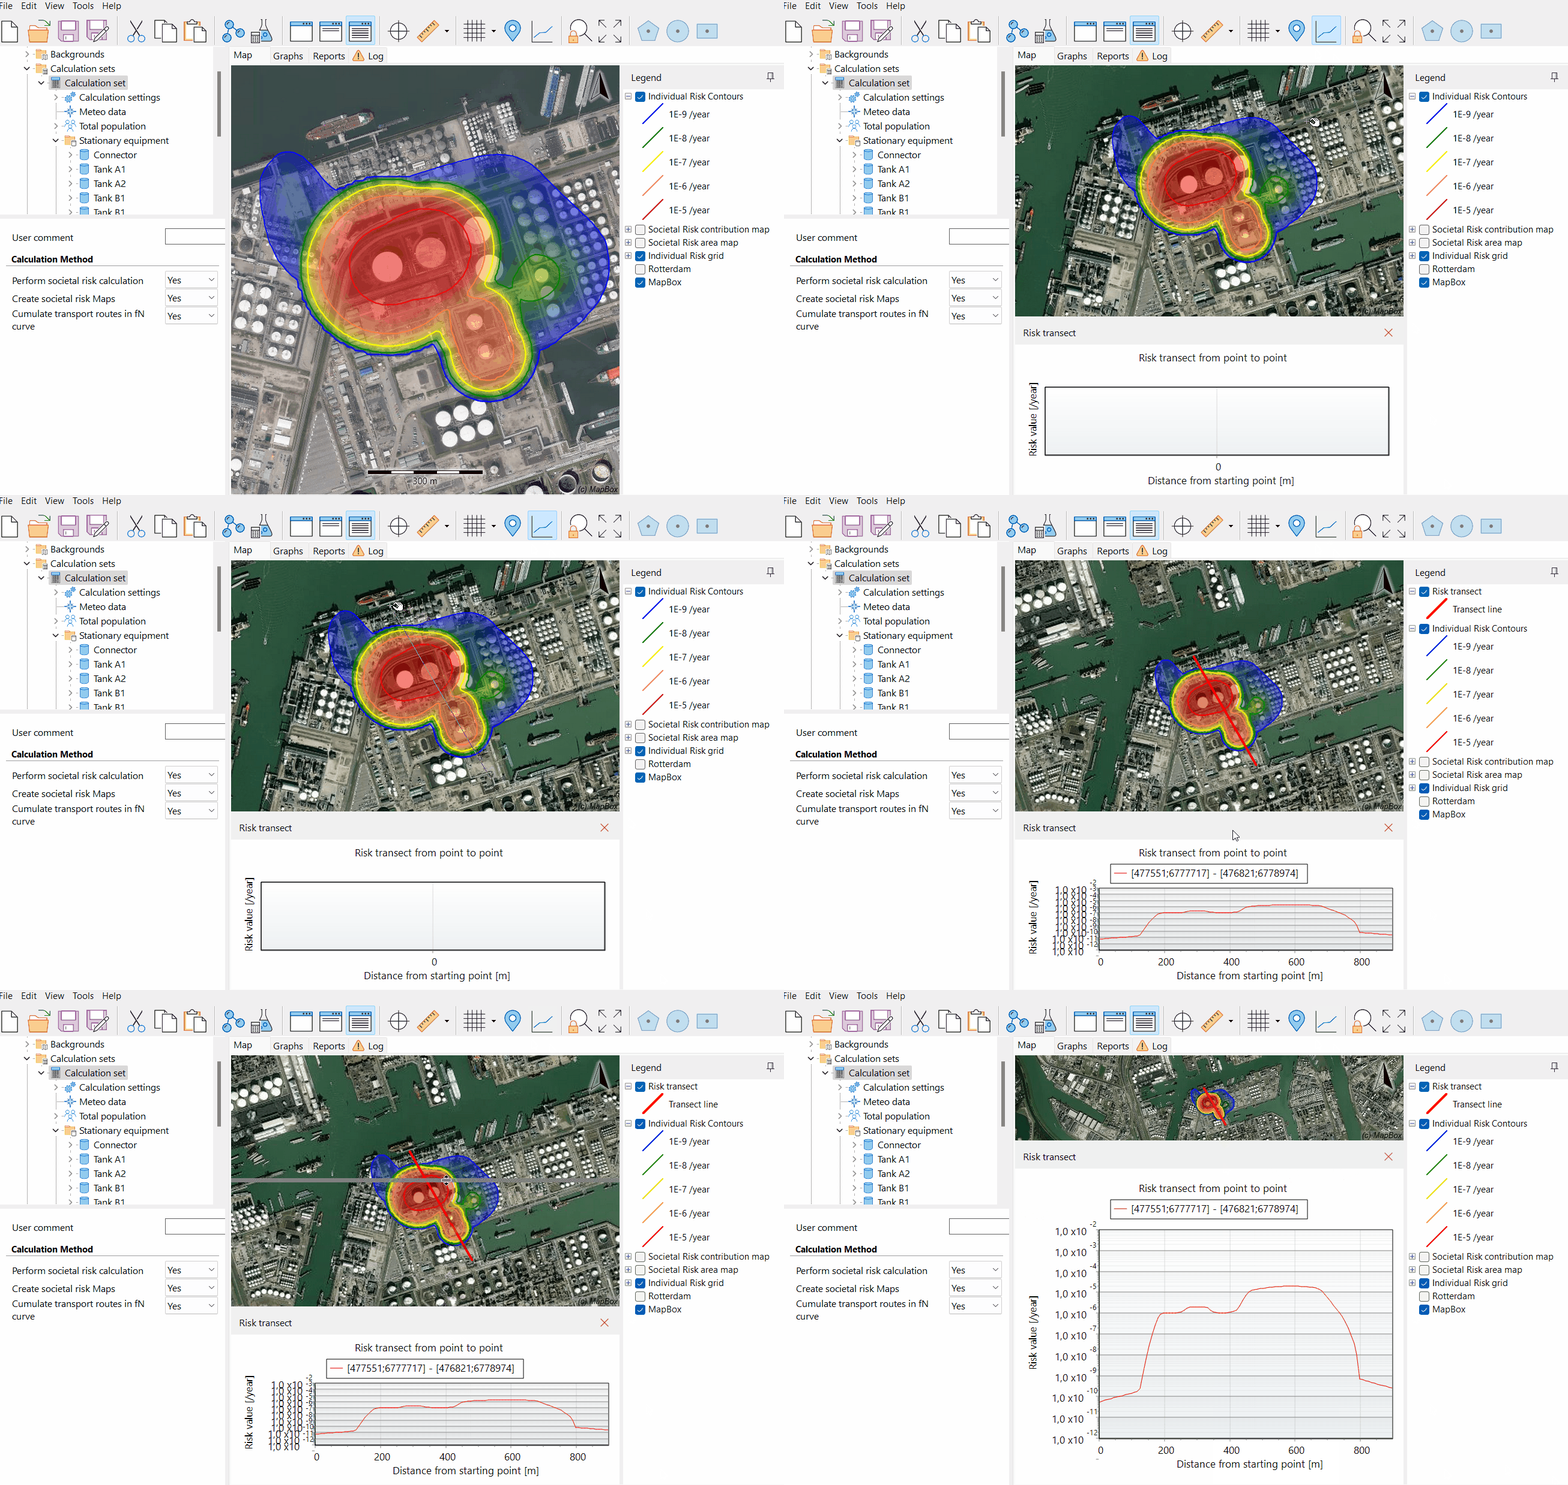
Select the "draw transect" tool
Click on the "draw transect” toolbar button.
Alternatively, choose the "draw transect" option from the map pop-up menu.
.png)
.png)
Draw the transect: Click and drag on the map to draw a line representing the transect.
View the transect graph: After defining the line, the corresponding transect graph will be drawn in the bottom right window.

Tip
Since the transect graph is relatively small in its default position, you can drag and resize this panel as a floating panel. All graphic functionality for graphs are also available for the transect graph panel.
Applications
Site planning and layout: Risk transects are essential for assessing risk levels along critical paths within a facility, such as evacuation routes or transport corridors. By visualising risk along these paths, planners can optimise the layout to minimise exposure to high-risk areas.
Emergency response planning: Understanding risk variation along specific routes helps in planning effective emergency response strategies. Risk transects enable the identification of safer evacuation routes and the positioning of emergency response teams.
Regulatory compliance: Risk transects assist in demonstrating compliance with regulatory requirements. They provide a clear visual representation of risk levels, ensuring that risk mitigation measures are in place along critical site areas.
Public communication: Risk transects can be used to communicate risk levels to the public and stakeholders. They offer a straightforward way to explain how risk varies across different areas of a site, facilitating better understanding and trust.
Conclusion
Risk transects in RISKCURVES are a powerful tool for visualising and understanding risk variations along specific paths within a site. By adding and interpreting risk transects, users can enhance site planning, optimise emergency response strategies, ensure regulatory compliance, and effectively communicate risks to stakeholders. This functionality not only aids in detailed risk assessments but also supports informed decision-making and safety management.

