Ammonia transport risk assessment
- 23 Sep 2025
- 7 Minutes to read
Ammonia transport risk assessment
- Updated on 23 Sep 2025
- 7 Minutes to read
Article summary
Did you find this summary helpful?
Thank you for your feedback!
Introduction
Ammonia is a widely used industrial chemical and an emerging energy carrier, transported globally in large quantities. Its toxic and hazardous nature requires careful risk assessment, especially during transport. This use case shows how RISKCURVES can be used to model the consequences and risks of an ammonia rail transport scenario, supporting decisions related to safety planning, land use, facility design and siting and regulatory compliance.
Scenario
Ammonia railway transport |
The pressurised ammonia is transported by rail from a production facility through a nearby residential area. The ammonia is carried in tank wagons, and the scenario assumes an accidental release caused by a train collision. 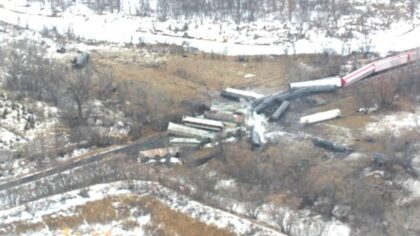 Accident scene (North Dakota, 2002). |
The objective is to assess both onsite and offsite risks along the transport corridor using RISKCURVES.
Offsite risk is evaluated using:
Location Specific Individual Risk (LSIR), to identify areas of elevated individual risk along the rail segment.
Societal Risk (SR), to estimate the potential for multiple fatalities in densely populated areas.
On-site risk is assessed using:
Individual Risk Per Annum (IRPA), to quantify the risk to employees during transport through the ammonia plant.
Process overview
1. Background
Before starting the calculation, it is important to add the background map. Background maps play a crucial role in visually representing consequence modelling results in their geographical context. This functionality allows users to precisely locate the accidental release of a hazardous chemical substance and assess its potential impact on surrounding vulnerable areas.
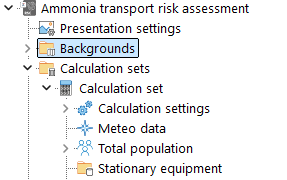
Location of Backgrounds node
2. Meteorological distribution
Within the ''Calculation set'', ensure that the correct meteorological distribution data is applied in the ''Meteo Data'' node. For this example, we use the predefined dataset for Rotterdam (Purple Book, 2005), which provides representative wind speed, direction, and stability class distributions for the region. Accurate meteorological input is critical, as it directly affects dispersion modelling and, consequently, the calculated risk values.
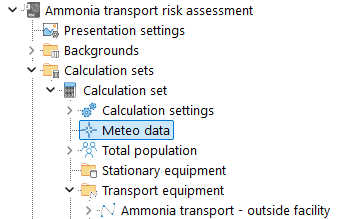
Location of Meteo node
3. Transport route
Within the ''Calculation set'' node, two types of equipment can be defined. To represent multiple locations along the railway transport route, Transport equipment is used. This allows the software to assess risk at various points along the path of the moving source, such as tank wagons carrying pressurised ammonia, enabling a more realistic and detailed representation of risk along the entire route.
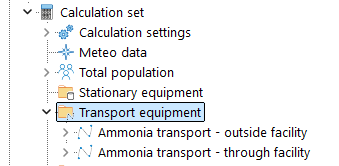
Location of Transport equipment node
4. Scenario calculation
Each scenario in RISKCURVES consists of two required components:
A Failure Frequency and Probability node – defining how likely the event is.
Scenario Failure Frequency and Probability node
A Consequence node – describing what happens if the event occurs and how far the impact reaches.
.png)
Scenario Consequence node
To perform risk calculations, both likelihood and consequence information must be defined.
Failure Frequency and Probability
In this example:
No ignition is assumed to focus on toxic exposure rather than fire or explosion.
The scenario uses a release frequency from a tank wagon inside the facility (Purple Book).
Consequence Modelling
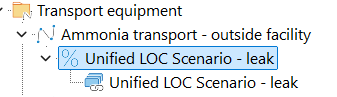
We use the ''Unified LOC Scenario'' model in RISKCURVES to simulate a leak from a pressured tank wagon, due to mechanical damage to a valve caused by a train collision. This model integrates source term and consequence calculations into an automated single workflow. This approach ensures consistency across modelling steps—from release to atmospheric dispersion.
Phenomena Selection
In this case, the primary hazard is ammonia’s toxicity, not flammability. Additionally, we only consider a leak scenario. Therefore, we exclude fire and explosion scenarios from the model and focus on the Toxic cloud (dispersion and exposure).
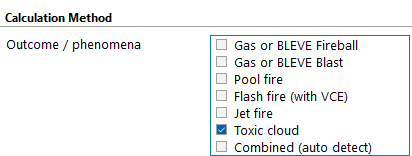
Outcome selection box
For users unfamiliar with all input parameters, the Pressurised Ammonia Release example in the EFFECTS use case library can be referenced for detailed guidance on the consequence modelling part of the example.
5. Risk calculation
Location-Specific Individual Risk (LSIR)
LSIR is calculated automatically by RISKCURVES once the project is successfully run. It represents the risk to an unprotected person permanently present at a specific location and does not require additional configuration.
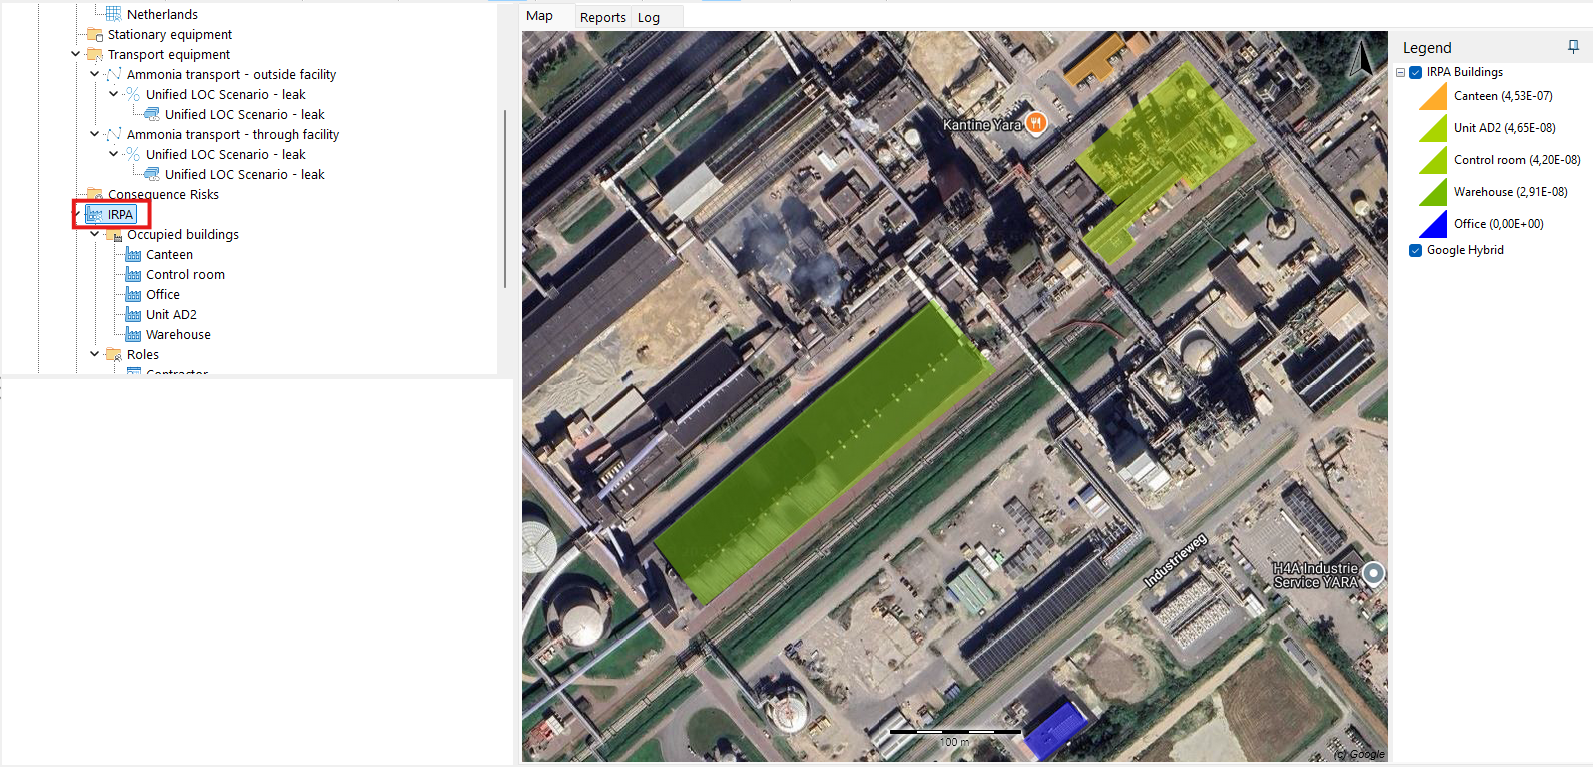
Individual Risk per Annum (IRPA)
In RISKCURVES, IRPA is configured under the ''IRPA'' node within each calculation set.
To calculate IRPA for individuals present in fixed locations (e.g. buildings), the user must define each area under the "Occupied Buildings" section of the IRPA node.
.png)
Location of Occupied building node
To define IRPA
Draw an area of interest on a map (e.g. control room, office, warehouse)
Assign properties of the building: presence factor (fraction of time people are present), number of individuals, optional protection factors (e.g. building shielding, PPE)
In this scenario, we define the following buildings:
Building name | Canteen | Control room | Office | Unit AD2 | Warehouse |
|---|---|---|---|---|---|
Presence factor % | 50 | 70 | 50 | 30 | 50 |
Number of people | 120 | 8 | 52 | 3 | 12 |
Protection factors | None | None | None | None | None |
Once this input is provided, RISKCURVES automatically calculates IRPA values for each building based on the combined frequency and consequence data from all scenarios in the calculation set.
For roles that involve movement across multiple locations on-site (e.g. operators, contractors), IRPA can be configured under the "Roles" section within the IRPA node. To define a mobile individual:
Create a new role under the IRPA node → Roles.
Assign a time fraction to each location to reflect the typical duration the person spends in that area.
In this scenario, we define the following roles:
Operator 1 | Operator 2 | Contractor | |
|---|---|---|---|
Presence | 5 days/week | 5 days/week | 50 days/year |
Canteen | 1 | 1 | 1 |
Office | 0 | 1 | 0 |
Unit AD2 | 2 | 0 | 5 |
Control room | 5 | 2 | 2 |
Warehouse | 0 | 4 | 0 |
This setup enables RISKCURVES to calculate a time-weighted average IRPA across all assigned locations, providing a realistic and role-specific risk profile.
Societal Risk
By definition, Societal Risk calculation requires the presence of a population. To enable Societal risk calculation:
Ensure that "Societal Risk" calculations are activated in the ''Calculation set'' node.
.png)
Select ''Yes'' to include specific Societal risk calculation
Provide relevant population data, which defines the number and distribution of people along the transport route or in the surrounding area. In this example, population data from WorldPop, licensed under the Creative Commons Attribution 4.0 International License (CC BY 4.0), was used. The dataset was converted into an .asc file using the commercial QGIS tool and imported into RISKCURVES as a population grid. The data can be viewed in the project file at the end of this exercise.
6. Risk evaluation
For off-site safety, to assess risk for one individual, we look at LSIR. To evaluate LSIR, navigate to:
''Calculation Set'' > ''Map tab'', LSIR iso-risk contours represent accumulated risk from all scenarios.
.png)
LSIR iso-risk contours and grid: all scenarios in the calculation set
''Equipment'' > ''Map tab'', LSIR iso-risk contours reflect only the risk from scenarios under specific equipment.
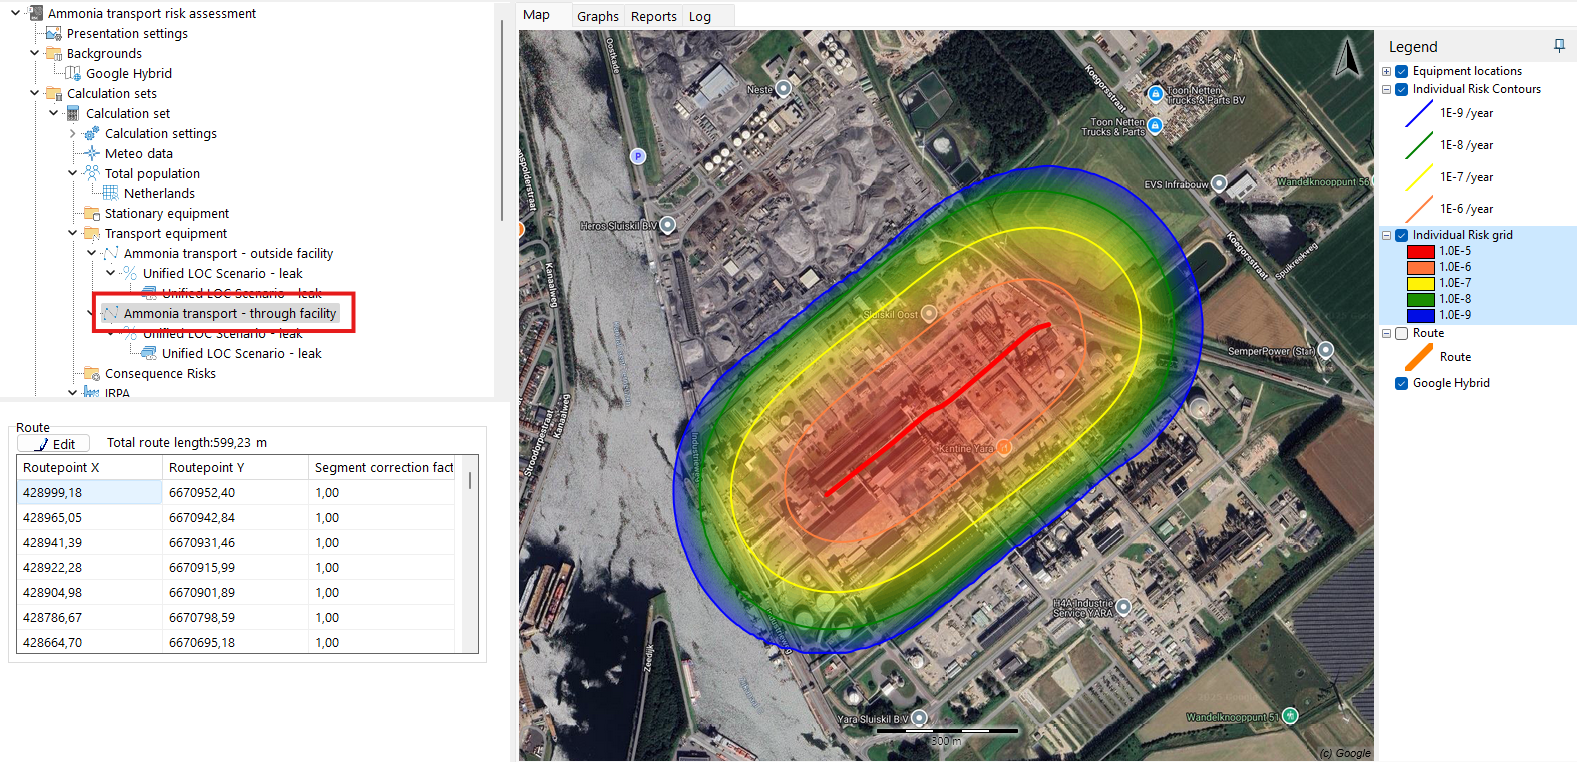
LSIR iso-risk contours and grid: Ammonia transport through the facility
The legend on the left indicates the defined risk levels, while the map highlights areas reaching each threshold. In this example, the highest risk level is 1E-6/year. This may or may not be accepted. Acceptance criteria are not only country-specific but may also vary depending on the study objectives and the characteristics of the analysed population.
The presented levels for LSIR iso-risk contours can be adjusted in presentation settings at the top of the project tree:
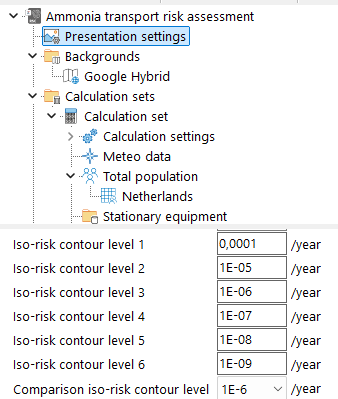
Location of iso-risk contour levels customisation
To assess the risk to the population, we focus on the Societal risk presented by the fN curve:
In the ''Calculation set'' node > ''Graphs'', the fN curve reflects total Societal Risk across all scenarios within the calculation set.
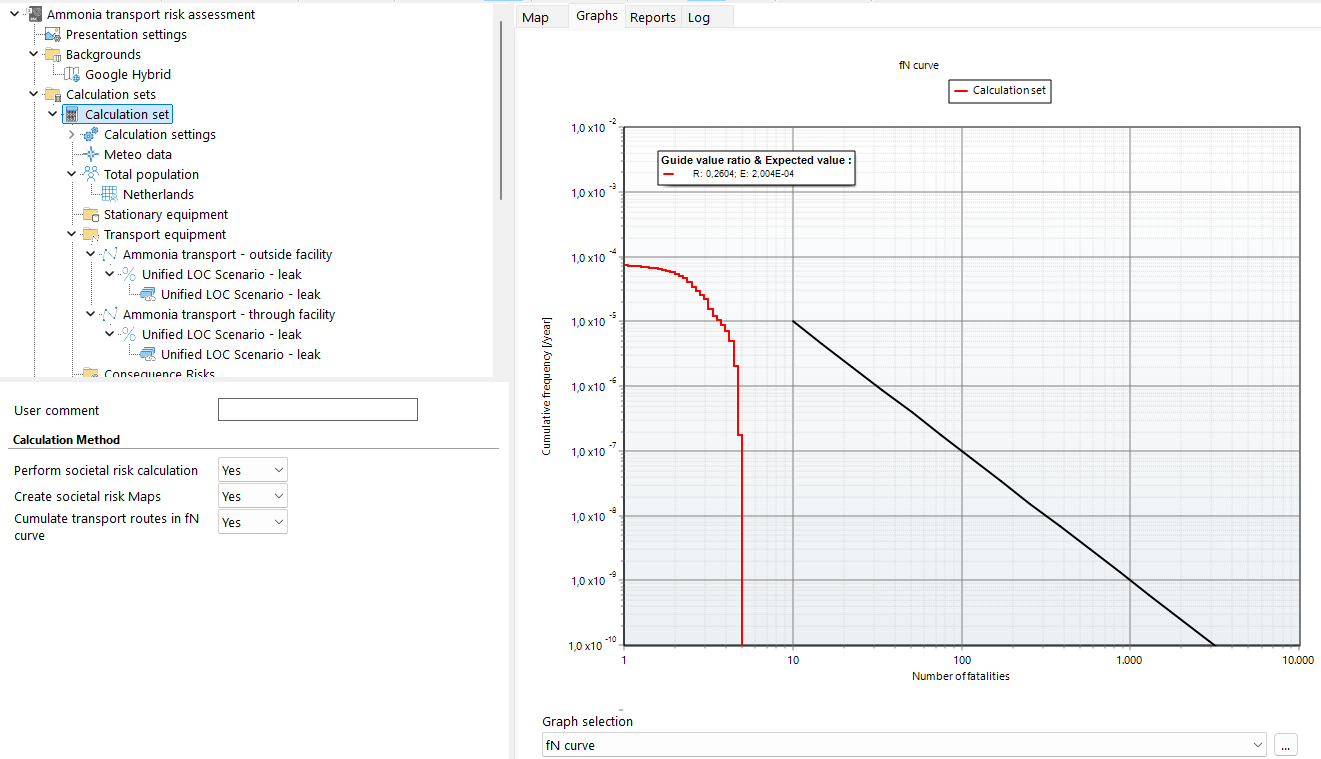
fN curve accumulated for all scenarios, located in the calculation set node
Within each ''Equipment'' > ''Graphs'', the fN curve shows the equipment-specific societal risk fN curve. For transport equipment, the fN curve can be displayed per section or entire route, which is adjustable below the graph.
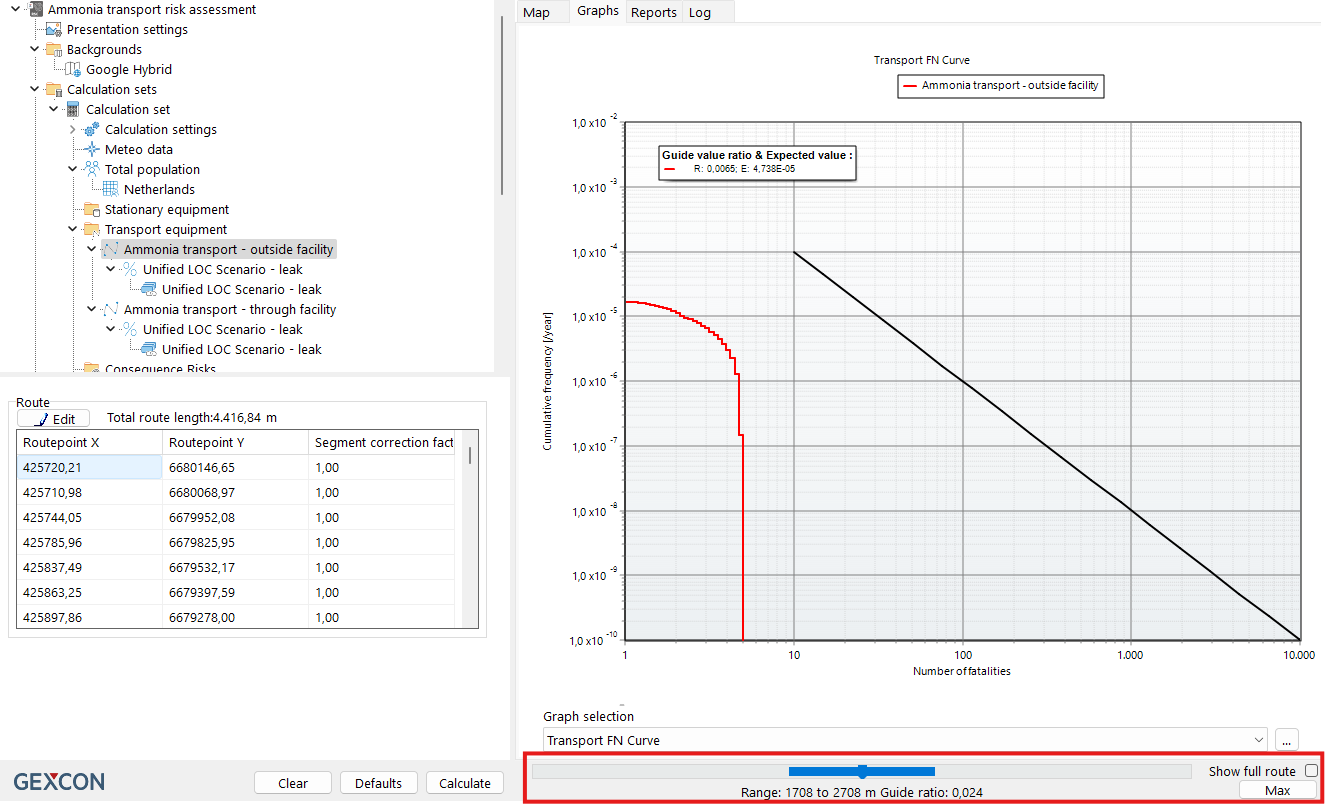
fN curve for single transport scenario
Since acceptance criteria may vary between countries, you can also adjust the guide value accordingly in ''Presentation settings''.
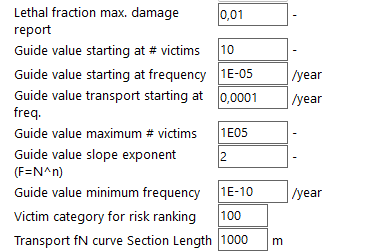
Guide value properties - Presentation settings
However, fN curves do not provide spatial context. They don't show where risk is exceeded, or which locations or scenarios contribute most to the potential impact. To address this, RISKCURVES incorporates Societal Risk Maps:
SR Area Map: Highlights geographic areas where Societal Risk thresholds are exceeded.
SR Area Map
In this case, the map colours indicate that there are no significant hotspots, which corresponds with the results shown in the fN curve graph.
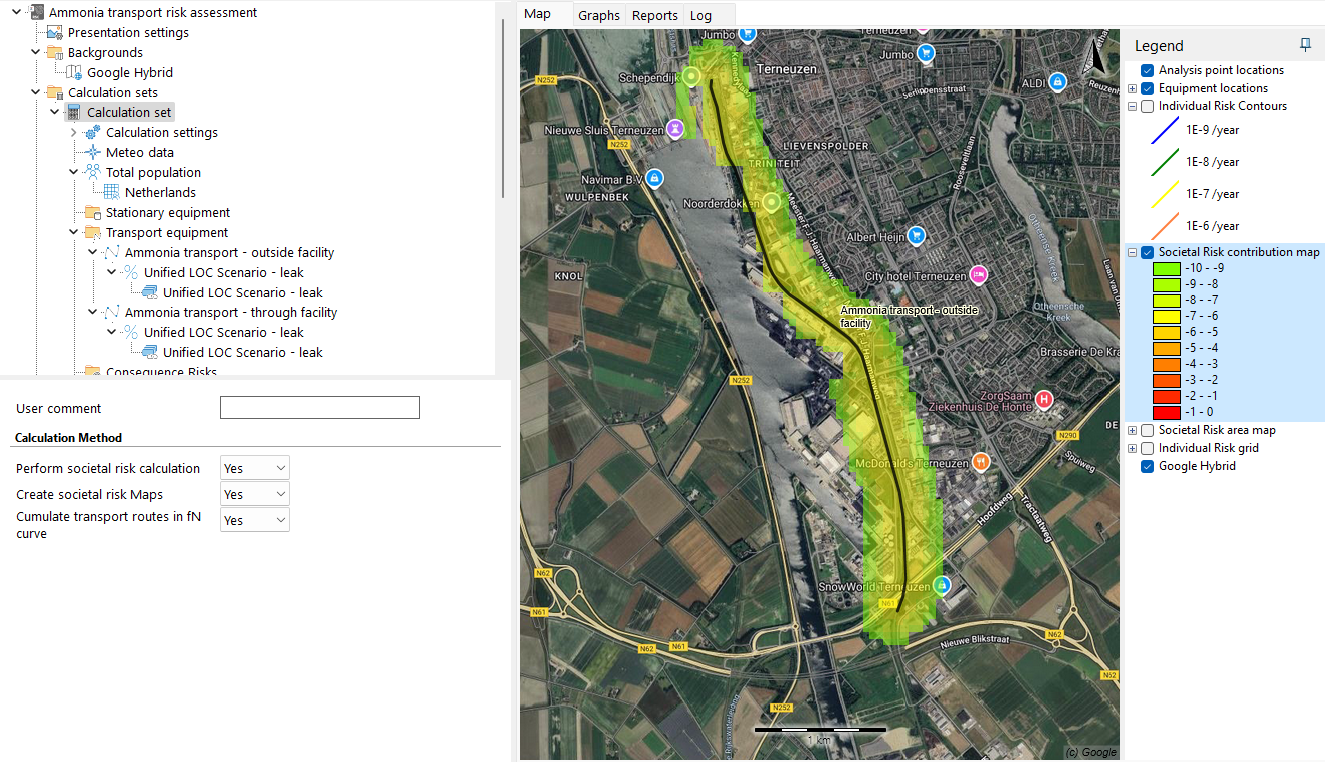
SR Contribution Map: Identifies locations where accidents are likely to cause high numbers of fatalities, based on Potential Loss of Life (PLL).
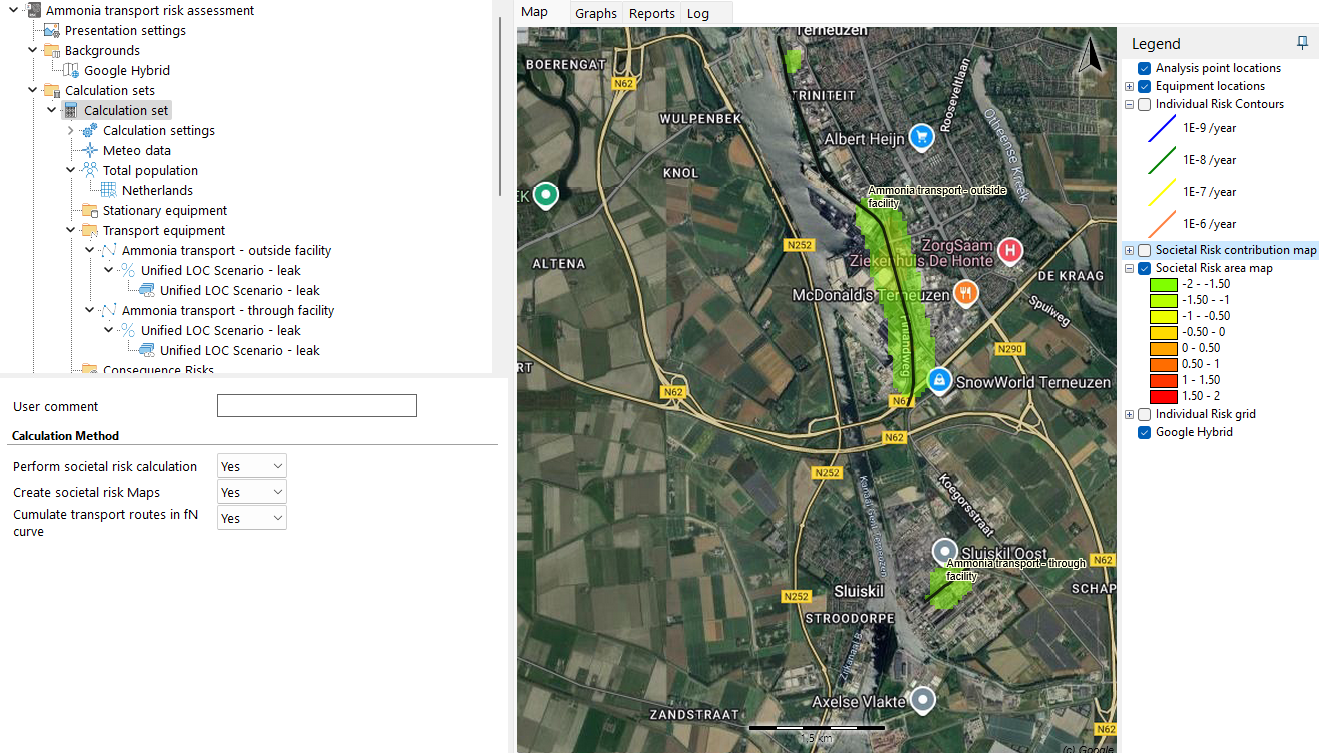
SR Contribution Map
In this case, the map shows no red or orange areas, indicating that at all locations the risk remains below the guideline value, which is consistent with the results in the fN curve graph.
For on-site personnel, IRPA results can be found under the corresponding ''IRPA'' node:
The IRPA map gives a full overview of the average IRPA for specific buildings/areas.
The IRPA report provides detailed risk data for each building and each defined role.
.png)
IRPA full report
For further granularity, you can explore reported results within nodes associated with specific buildings and roles with presence patterns (e.g. operators moving between locations). For example, below is a grid showing IRPA values over the building or area.
.png)
IRPA building grid
Download the project file
Take a look at the Societal Risk calculation in RISKCURVES and evaluate if the risk will be acceptable in an urban zone after the population increase.
To view the project file, please open it using the RISKCURVES software. If you don’t have the software, you can download and use the free viewing demo version of RISKCURVES via the link below.
References
National Transportation Safety Board. (2004). Railroad accident report: Derailment of Canadian Pacific Railway freight train 292–16 and subsequent release of anhydrous ammonia near Minot, North Dakota, January 18, 2002 (Report No. NTSB/RAR-04/01). Available at: Link
Committee for the Prevention of Disasters (CPR). (2005). Guidelines for Quantitative Risk Assessment (Purple Book) (CPR 18E). Directorate-General of Labour, The Hague, The Netherlands.
Was this article helpful?